Here is just a small part of my notes I write for my own reference.
Pictures are bit compressed but they are clear and readable.
This are continuation of previous weeks notes from the Google group I've mentioned few post back, which will be available for a while before I delete them.
You will also find notes on 16 more pairs. I publish them by mail directly from the charting program and it's a life saving option.
This Blog somehow does not accept the same mails and it complicates the whole thing.
While I don't mind sharing my notes and thoughts, I'm still not very sure if it is useful to anybody.
Any way, until I find a solution that will save me time preparing and publishing my notes, I'll try keeping this blog live with at least few views published once a week over the weekend.
Thank you for your mails and interest in my analysis, and I hope to be able to spend more time answering all of your questions.
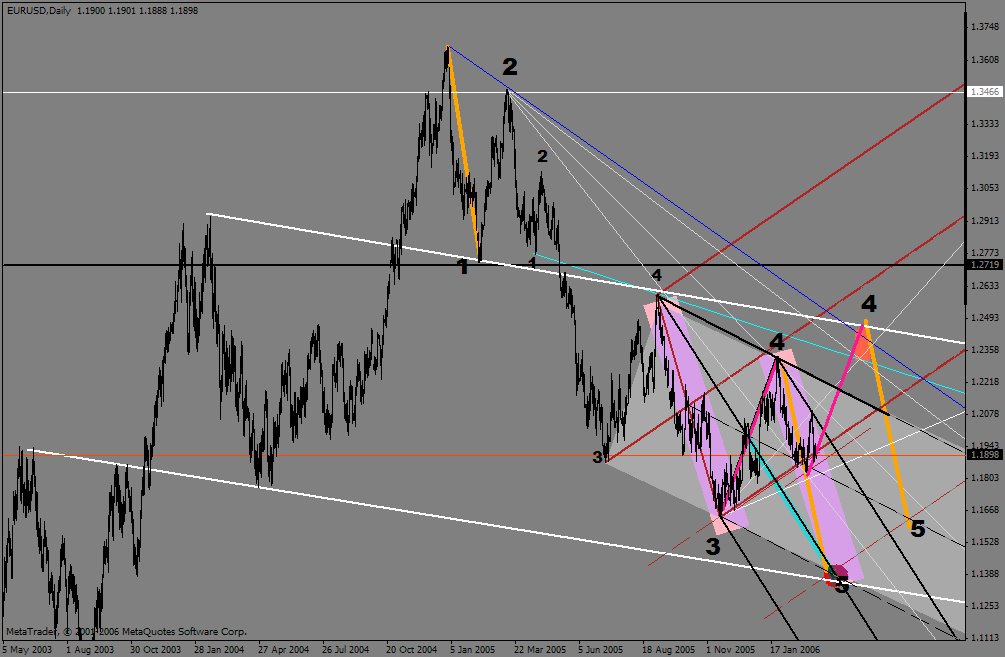
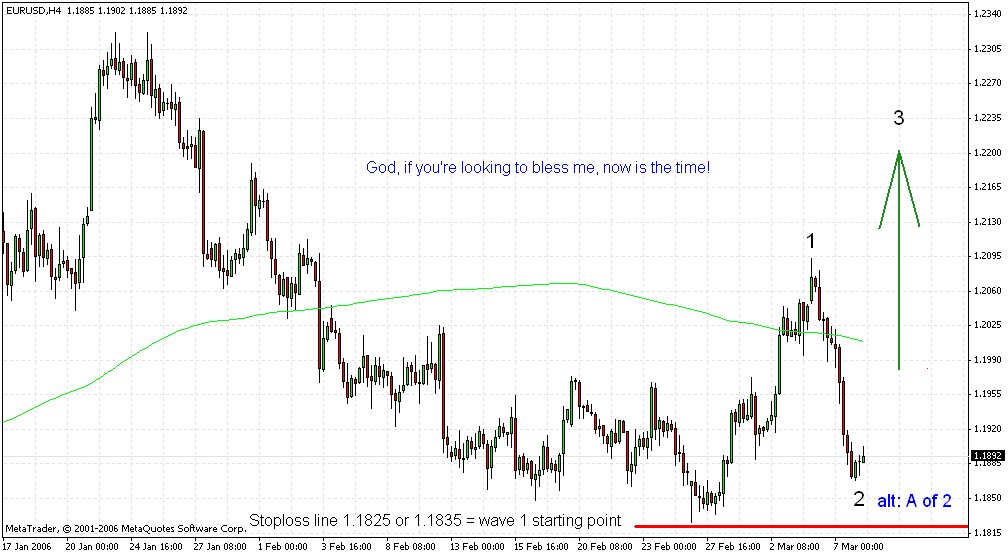
EURUSD
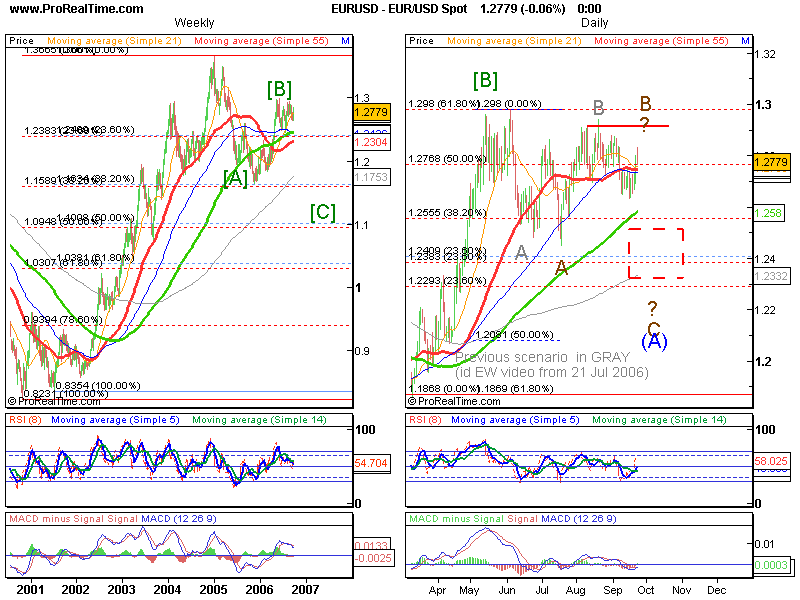
I mentioned last week that I don't quite like what I see on the chart, so I reconsidered my view.
I made a slightly different count from the one in the last video analysis I published, hm when was that, 21 July, quite some time. Any way here it how I see.
So, I have two possible target areas on the upside to finish that B on the Daily if not finished at Friday daily bar high. On a break of 1.2831 last Daily bar high, first up is 1.2872/77 and second is close to the previous top 1.2926/37/48.
Break down below 1.2725 to ease the upward pressure and below 1.2632 to confirm possible C of (A) down.
And here is the Hourly chart for more detail.
I personally think it is a top, but caution is needed.
idejan

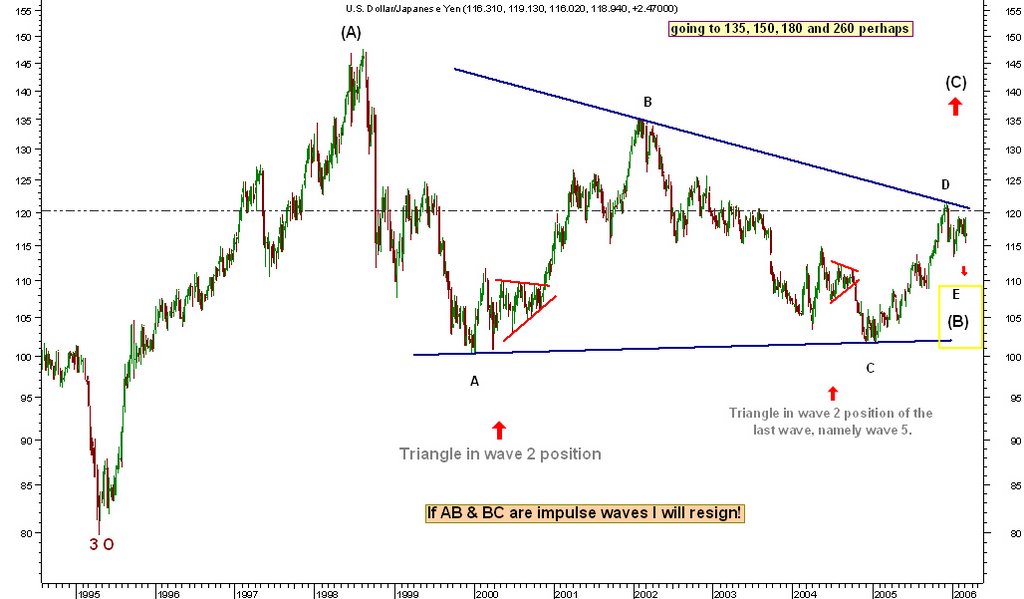
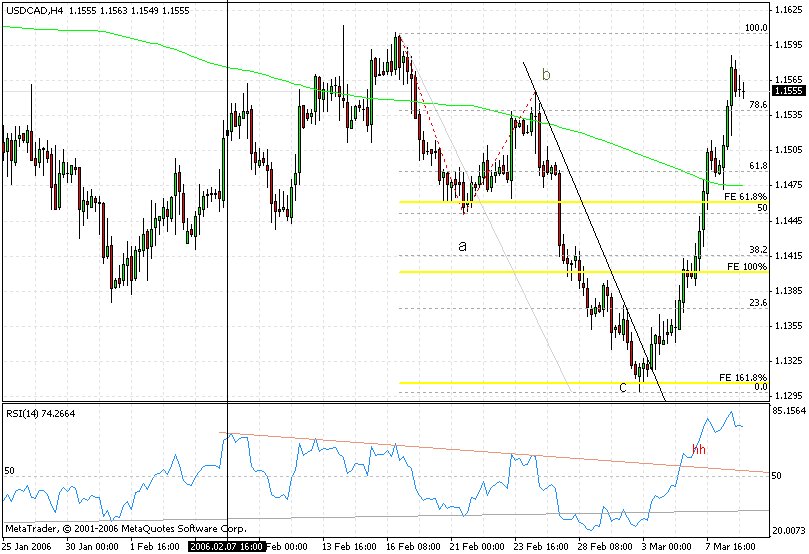
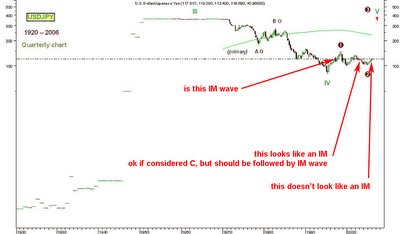
USDJPY
It is on target (see prev. post and for more targets too) but could end little lower, probably 115.84/53 to continue up...
idejan

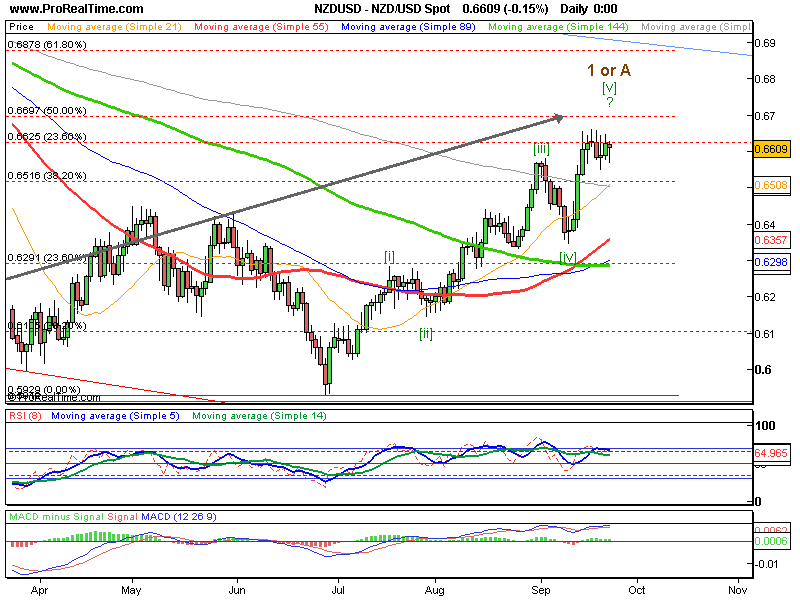
NZDUSD
Intraday probably lower to 0.654<>0.65
There are slightly different scenarios (EW counts) than the one on the chart in which we could have a Minute or Minor top.
If so than the correction could go lower than 0.65, to possibly 0.63.
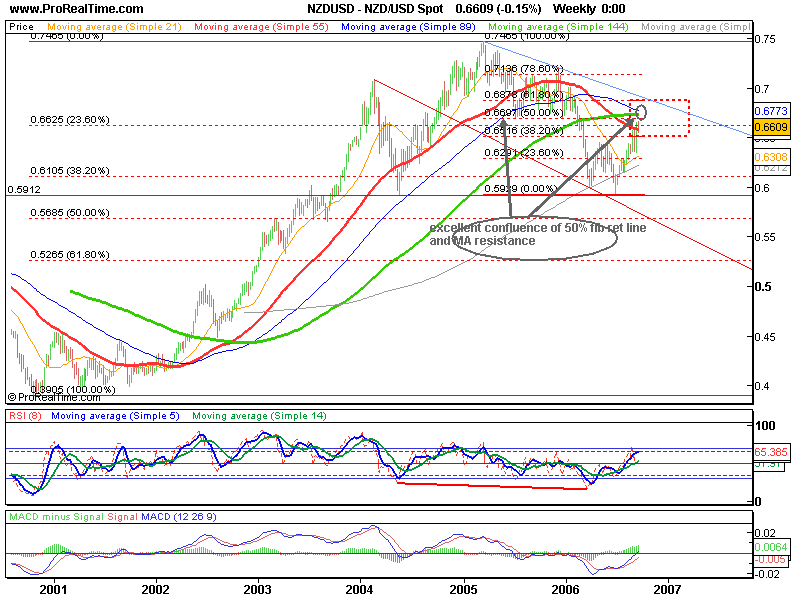
I still think it will finish little higher before it makes the second wave 2 or B. (see next chart weekly)
idejan
Here is the weekly chart and that nice confluence of Fib 50% Retracement line and MA resistance
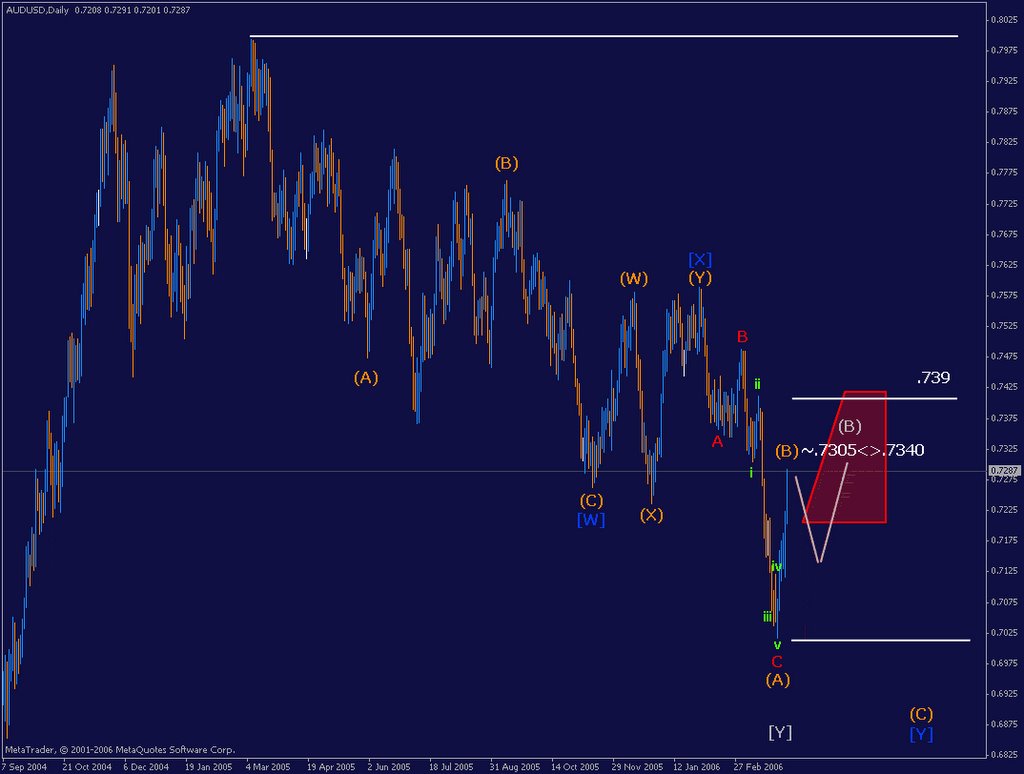
AUDUSD
It made high 0.7580 and still above the green MA. (also see weekly)
(prev. bar on the weekly low @ 0.7483; red MA @ 0.7482 green @ 0.7490 and last bar low @ 0.7494, red @ 0.7479 green 0.7491).
This is the support needed to break to confirm down targets. First most probable target down is 0.7279/70 to continue down to 0.7 and below to 0.6792/81/72 targets...
idejan


