Pay attention to 0.7220/00 for a possible retracement to 0.7400/50 before it continues down to min. of 0.6860<>0.6600 to finish the whole correctional pattern from march 2005 and continue up to min 0.9 possible target zone from 0.88<>0.98.
Immediate move above 0.7335 could indicate possible minute bottom at 0.7269 for a retrace to mentioned .7400<>.7450
EURUSD

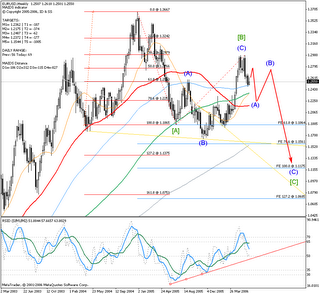
Current bottom at 1.2478 is right in the box for a D3 (Double three) (y), both by time and price, so we have a very possible finished Minute [a] and a started wave [b] of the first Minor wave A down of a larger intermediate (A) (possibly it could be that we should use one degree higher for all waves and it will finish a Primary [C] wave).
If so, then we can expect wave [b] to target 1.2640 to 1.2780 but probably 1.2664<>1.2717 to continue down in a wave [c] to finish first Minor wave A down, probably to 1.22/21 possibly lower to 1.1960/20.
Larger Intermediate wave (A) (or Primary [C]) to target min 1.15 but possibly lower to 1.1<>1.09 even 0.9 but I'm not that bullish on Dollar yet :). Let market give us clues step by step.
*forgot to add this on the chart: wave [b] is right to the pip on the 61.8 fib of wave [a] and just a little above 161.8 fib extension of (A) from the (B) for the wave (C) of that [b].
USDJPY
Well my upper target level was overshot by some 60 pips (115.70/116.10) and now looking from the 109 bottom it is into the upper target area for a finished pattern, but looking on the last sub wave pattern it shows a possibility of extending higher to 117.5/118/118.5, but I don't expect this to happen, and I believe that we are about to see a retracement in a wave [b] Minute of the first Minor wave A of a larger Intermediate (Y) to finish a Primary wave [A] around 128<>145 by the end of the year. It is the first leg of a wave c Cycle correction of the Supercycle correction wave (b) from April 1995 bottom which is to finish in the next 3 years into 144/170/190/210 target area, which is looking way too far into the future :) and we better let market guide us. Temptation :)
(I'm aware the pictures would have been much clearer, but patience please.)
NZDUSD
Attention required. It is into the most probable target area so we can have a finished drop here, but it could finish lower as I published, around 0.586.
Questions remain to be answered:
- will this finish the whole pattern and we are to see a continuation up?
- or it will finish just the first wave of larger correction, so we will see a 3 wave correctional wave [B] up and then wave [C] down?
I hope to be able to have that answer very soon. The structure of the next move up will give us some clues.
USDCAD
just shortly
If we stick to the view that the drop from Jan 2002 top is IM wave down then we have more on the downside as I've published in some of the previous posts. Or below 1.0000
If we consider that Currencies don't develop IM wave of a SuperCycle degree, or that they tend to move sideways, then USDCAD could be ready for a reversal up. A move above 1.18 would certainly be a very good argument for that.
Anyhow, we can expect to see a move to 1.14<>1.15 before we can decide on a most probable scenario. A break above this area will be a good indication that we could have a longer term bottom formed.
Of course, a break below the 1.093 bottom will confirm my expectation that we could see USDCAD much lower, 1.06<>0.9
Not in a shape yet. It took me too much time preparing this, it is late and I'll leave GBP and Gold for some other post.
Take care all of you there
idejan