Friday, March 10, 2006

Tennis Anyone?


Idejan,

Thank you for the video, very nice!! I guess months from now we all will be sitting back, studying them charts and saying ”That’s what was going on”. Until then the hunt continues.

Late last year I was convinced that we were ending a 5th and headed north for a correction, and although price has headed north from the first of the year it has done so with reluctance. And while it has been hard for me to number some of the smaller degree 5 waves in some of the earlier price action, either motive or larger corrective zigzag, I’m now starting to think there’s more south to come.

Price has held again today on yet another sliding parallel from the prior daily fork, as long as this holds it’s making me think that more range trading is to come. Now wondering if we are in the final wave of an ABC correction from the end of last year.

Thinking that this is like a failed C” wave triangle or perhaps a flag?( A bear's thoughs). If this view is correct we could have another test of the top the “c” followed by a test of the low “d” and then a brief run to “e” and then the bottom would fall out.

Just trying to stay a step or two ahead…..

Well for some reason I can’t add a picture again will edit when able…………problems solved

USDJPY: The fundamental aspect.

Its Price, Price, Price, but the Interest Rate scenario is tied very closely to investors' purse strings -- that's the reason I pay attention to monetary policy in Japan.

Another compelling reason is that the Yen dances to nobody's tune. It is one heck of a loner; ninjas, yakuzas, Mafia, gurus and everybody worth anything has tried to come up with some sort of correlation that would provide clues to how the Yen works. So far, zilch; a dead end.

With the dollar, you could look into bond yields, Libor differentials, Forward Rates, Fed funds Rate etc., to get some idea of what is going on. With CAD you look at the Toronto Stock Exchange for clues along with fund inflows and the CRB component of the Stock Exchange etc.--

But with the Yen, there's not a single thing that comes even close to giving a halfways decent clue.

What all players want to know now is this:

"Will the end of Quantitative Easing be followed quickly by the ending of the zero interest rate policy?

That's the ticket, guys.

Japan has flooded the universe with liquidity, & has been a main source of capital and savings for the world. Now that looks like it is going to change.

I have an answer to the dilemma and therfore one more key point in my ongoing decision whether to buy (long) USDJPY or not!

The Quantitative Easing policy did not begin in earnest until 2003, four years after interest rates were reduced to below 10bp in 1999 and two years after they fell to absolute zero in mid-2001. Thus a gradual reduction in bank reserves from the present ¥35 trillion to ¥15 trillion (where they were in 2001) or even ¥5 trillion where they were in 1999 would be perfectly compatible with zero or near-zero interest rates.

It is highly likely that BOJ will reduce liquidity while maintaining a zero Interest Rate policy for this decade.

There is a good reason for sticking with the zero interest rate policy.

Japan has a huge government deficit and a very high level of public debt relative to GDP. Thus when the economy gets strong enough to withstand a deflationary impact, the Japanese will want to hit it with fiscal rather than monetary tightening. Tax increases are already in preparation for 2007 or 2008 and to make sure that they can be implemented without causing a 1997-style economic disaster, Bank of Japan and Ministry of Finance officials have agreed that monetary policy should remain ultra-loose for the foreseeable future.

All the discussion about ending Quantitative Easing seems to have persuaded many investors that the zero rate policy is also about to be abandoned. The Japanese yield curve is now discounting a very aggressive increase in interest rates, with short rates expected to rise by 75 bps this year and 150 bps by the end of 2007.

I am stating that Interest Rates will remain under 50 basis points or so for the next few years.

I'm satisfied with my fundamental analysis of the situation and furthermore, one more point in its favor is that now the herd is going strongly towards rising Japan Interest Rates. I certainly don't want to go with them. The opposite is the more likely scenario, namely, rates will stay close to zero!

Divergence study is now complete! Thanks.

Wow! You took it even one step further than I was envisioning -- I had not even considered a divergence between 5th of (iii) and 5th of 3.

Man, I tell you, this is one heck of a top-notch class I'm fortunate to be in.

Its the basics that are popping out at me and all my failed purposes with EW are getting rekindled.

I believe that in a year or so, I'll be a force to reckon with.

Thanks buddy.

NEW EURUSD video analysis

I posted a new Video Analysis on EURUSD and you can find it by clicking on the link in the right sidebar.

While I was prepearing the files for publishing, uploading the files to the pages price made a strong spikes down, stil it can't be taken as a confirmation. I'd prefer this to clear up before it can be clear if we have a confirmation down or we can expect this to be still part of the correction.

RSS Feed link
For those that use RSS readers and would like to receive this blog via RSS, use this link to add this Blog into your feeds.
http://waveid.blogspot.com/atom.xml

ID

Joseph: divergences in 3rds


This chart was prepared for that previous post, and I was confused when I saw your post today, since I was not aware I've missed posting it.
So here it is, and as you can see I agree with your observation about the divergences in 3rd waves, actualy as I wrote in previos post in my observation, 3 wave cycles are not producing divergence and any 5 wave cycle (which means not only IM) are giving divergence.

Divergences in the substructures are reflected too depending od the degree and the time frame you are observing.
I haven't done a study on this, but when I've mentioned observing patterns on RSI I was reffering to this.
I dont have MACD on my charts so I can't speak much about it but it is clear to me that you can't play divergences on their own, but reather use them for inforcement on price patterns.

Now Joseph, I became aware that there are questions I've missed answering, so if it's not too much of a trouble to you, could you please mail me all of the questions by mail so I can have them addressed one by one.
Dejan

Myth busting # 3 (contd) Fed funds Rate

How did the moron try to kill a bird?

He threw it off a mountain cliff !

-----------


See my earlier post on Fed funds Rate going way, way up into the clouds.

And what were the geniassssses saying then? 4.5, perhaps 4.75 tops and then we go down, down, down!

What are they saying now?

"Over the course of the current tightening cycle, many market participants have been repeatedly surprised by the magnitude and duration of the Federal Reserve’s action. Several times the market has gotten it into its collective head the Fed was done — including in the immediate aftermath of Hurricane Katrina, or the “one-and-done in 2006” sentiment — only to reverse itself later. Analysts are now forecasting additional hikes to the 5.00-5.50 percent range before this cycle is over."

Why can't a moron dial 911?

They can't find the 11 on the phone!


Myth busting # 4: Trade Deficit & USD


If you mow your lawn and find a car, you're a redneck.

But a Moron? .... that's a whole different ballgame .....

Why did it take the moron an hour to eat breakfast?

Because the orange juice carton said, "Concentrate!"

How many times have I heard the dollar's problems blamed on the Trade Deficit? Hundreds of times ... and by every single major News org and TV station to boot.

Recent examples: (plucked from EWI site; I have my own charts on this subject but their's are superior, so I present it here instead of my own)


“The US trade data for January is due on Thursday and may trigger some selling if it draws attention to the structural problems facing the US economy.” (AP)

“With expectations for a wider-than-expected result in the US trade gap, there is enough scope for disappointment, making the dollar vulnerable.” (Forbes)

“The widening of the US trade deficit was a key factor behind the dollar’s three-year decline through the end of 2004 and currency analysts warn it may send the US currency falling again.” (Reuters)

EW lesson 1 ... (contd) .. divergences before wave 5!!!

I know quite well about divergence showing up in wave 5. I am talking about subtle divergence showing up BEFORE wave 5 -- actually at the very end of the 3rd of 3rd.

There is NO Elliott rule on this, I am sure, but I was asking if you personally had observed any such occurrence?

I have, actually -- in spades, and would very much like you to give it some thought over the next several weeks, if you haven't already.

Here's the gist of it: (refer to uptrend as an example)

The 3rd of wave 3 produces maximum impetus which is clearly visible on Macd histogram, Macd and RSI(14). Then, when the actual wave 3 completes, generally there is a clear negative divergence already showing on these 3 indicators. So, actually this is the start of the divergence -- it actually starts right after 3rd of 3.

Then wave 4 generates a lower low usually and shows larger displacements on the histogram, Macd and even RSI generally.

From this huge drop in momentum, it is easy to see why wave 5 delivers the final divergence. There is just too much ground lost for it to make up, especially considering the fact that it is a terminating wave.

My point is that we've got to look earlier than wave 5 for the point when such divergence is actually being born!

EW lesson 1 continued .... answers requested.

Please see the same chart of Nikkei daily from March 2003 bottom.

(1) Yes ID, the black count is same as your count. OK, no problem here.

(2) Here's what I meant by the drop -- refer to the drop from the Feb 2006 highs. Keeping the degree of tend the same, i.e. Minor waves as shown, I was not sure where wave 3 ended -- January top or is it the February top. Sorry about the error in communication.

So, to repeat; could the Feb top be the top for wave 3 instead of the January top? This would mean that we are now in wave 4 down, with wave 5 yet to come.

Please clear this for me.

Thanks amigo.

EURUSD: wave 1 or A -- my answer to Bear's question.

This was my thought process -- humbly submitted. Don't know how many EW rules I'm breaking here, but ID can set me straight on this score.

Joseph's EW#1: Within the structure of the supposed wave 1, if there is no clearly discernible (ii) and wave (iv) looks like a picnic, plus the lack of any wave iv within (v) of 1, I smell a rat and this noxious smell usually is the malodorous, soon to be coming to life, wave B, farting in advance of initiation.

Joseph's EW#2: Look back to the corrective drop in early 2004 within the previous bullrun -- if the 2005 drop is wave 1, it is as dubious as a one-legged man in a butt-kicking contest! ..... especially considering the long 4-year bullmarket, one would expect a true wave 1 to kick better ass.

Joseph's EW#3: First waves aborn out of BASING structures and sometimes even in these bases they are hard to distinguish because they never rise out of the base and get hammered by wave 2 within the base itself. This type of wave 1, I call a faggot because wave 3 then has to do all the work while wave 2 thoroughly buggers wave 1.

The other type of wave 1, also out of a basing pattern, is a sight to behold -- this is a different animal altogether. Even on the chart this type of wave 1 looks exactly like an underpantless gigolo who's just seen a beautiful, sexy woman with lots of money.

There was no basing pattern in 2004, therefore this is one more point I used in the elimination process. Odds here heavily favored a wave A in my book.

Joseph EW 4: Wave 1 has a definite tendency to whack the uptrendline; at least put a dent in the sucker. If this was a wave 1, he kissed it, fondled it, got his sacs emptied and then rebounded -- here then is another reason why we are dealing with an A, because wave B of A is next -- the perfect setup for Euro bulls to buy the dip and go Long ..... to eternity, hehehe.

I speak only for myself -- and keep in mind that I've been sent here to blow my account to smithereens & to ensure that the Scriptures are fulfilled! :) :)

On a more serious note:

actual confirmation that we are not dealing with an OVERALL impulse wave for the entire 14 month run starting from December 31, 2004 is further confirmed only in hindsight by the following points:

(1) If the first drop was a wave 1, then the subsequent wave 3 into July 7th, 2005 was a mellifluous pussy. Why? Because even Jack was still bullish the Euro. No recognition in the 3rd of 3rd that "hey, this is dangerous, something weird is occurring" -- I'm going to get buggered if I don't reverse and jump on the train. I'm going to be left behind." None of this type of thoughting, thunking or whatever.

And what's been happening for the last several months, since the July bottom, is the characteristic limp dick wave B, fooling everybody with divergence galore, making all kinds of noise to mask the truth that he can't get it up. The reward at the end of this charade? Full retracement by big dick wave C to under 1.0000!

Adios!

Wave impressions


Thought I’d throw up a chart I have running in the background with the two predominant views, and ask a question for you Elliott Waveticians.

One of the points that was brought up in the Videos was the fact that reversals start with impulsive/motive waves, and that appearance has a lot to do with nomenclature.


Looking at this, maybe it’s just me but this euro fall from the start of last year, looks impulsive?????

I know there are many counts regarding this as a corrective wave, and using the old adages “you can’t tell a book by it’s cover” but “if it looks like a flower and smells like a flower, chances are it is a flower, ummm - motive wave? :)

Thursday, March 09, 2006

Nikkei answers

Hi Joseph, Bear
The Alternation of waves 2 and 4 is not a rule it is a guidance, something to have in mind anticipating what could happen in a wave 4.
On your NIKKEI chart, ...but first let me just find something... A lesson I got from you :D..just a sec...

Here it is: Elliott wave counts work flawlessly only in hindsight! :D

Now back to your NIKKEI Chart.
If you go back to my NIKKEI chart you will see I labeled that part of the chart as your black count.
"My reason for the alt: red count is that the drop looks like a wave A and is not a 5-er"
I'm not sure if I understood this. Not sure what drop do you point and why it should be a 5-er.
Since you are analyzing a IM up, non of the drops must be an IM 5-er. To all of the drops on your chart, rules and guidances of the Corrections apply.
I'm not sure how would you label that alt. 3 if it is higher, his internal count?
On the part of your explanation about divergences in 5th, in my modest experience divergences show only in 5 wave structures, which means that beside the 5th of IM, they can show in parts of the corrections that could have 5 wave structures too.

as for the next questions on wedges.

Wave 4 can be any correctional pattern. So the answer to your "can the wave-C part of a wave 4 end in an EDT" must be searched in the rules for the waves C of the every different corrective pattern. Let see them:

ZZ
  • wave C of a ZZ must be either an IM or ED
  • if wave A of a ZZ is LD then wave C must not be an ED

Flat

  • C must be IM or ED

Triangle

  • C of Contracting Triangle can be any correctional pattern
  • C of Expanding Triangle must be a ZZ based pattern

Double and Triple ZZ

  • wave C of W cannot be a failure
  • wave Y must be a ZZ
  • Y must be equal or greater then X by price
  • wave c of Y cannot be a failure
  • wave Y must be grater than 90% wave W by price, and wave Y must be less than 5 times wave W by price

Double and Triple Sideways (D3 and T3)

  • wave c of W cannot be a failure
  • wave c of Y cannot be a failure
there few more rules on waves Y but no need to go into ore detail. What I can tell you is if you look too much into detail you know how the saying goes, stare into trees and you would not be able to see the forest.
Let your eye and intuition decide. Then if any doubts check rules. No way you can process all the rules and counts unless you trust what you already know, your intuition.
If it's easier for you, than try not searching for the Right Pattern, but for the Most probable one.
And as i mentioned many times, beside the fact that if you do your analysis well, EW will give you the right or at least the most probable Direction, the second most important thing is that you can tell at what point you are wrong and consider the next probable scenario.
Try to look for opportunities and not to be right.

As for "We also know that B waves cannot end in an EDT. Am I right so far"
since LD and ED are considered a special case of Motive waves (advancing) wave B cannot be either of this.

ID

Problems with audio solved.
video continuation to come.

Bear's declining wedge brings up another point

We know that the C-wave of a wave 2 can be an ending diagonal triangle (EDT) and that the same applies for 5th waves. We also know that B waves cannot end in an EDT. Am I right so far?

But, what about wave 4? .... wave 4s are generally triangles in their entirety, sometimes zigzags or flats, but ..........

can the wave-C part of a wave 4 end in an EDT?

Thanks Bear, good stuff.

Pour on the coal, Bear -- I've always liked your stuff, even at the graveyard. Good point with the count you've shown.

Yeah, things are certainly looking up at this little corner of the virtual world.

Thanks brother.


Joseph,

I’m not the Elliott Guru nor profess to be one, but throwing out my thoughts and we will see what Idejan thinks…

Thinking there should be some alteration between your 2 and 4 waves, possibly your finishing off wave 4 with the “B” being a running correction, the "C" being a declining wedge perhaps?? and you still have “d” and “e” to go in the "C" before up with wave 5.…

Just a bare brained thought.

USDCAD: I'm laffin so hard my head hurts.


:) :) :)Here's my post from March 3. Let me boast a little as a newbie, OK? I'm tickled pink.

"75% probability for ignition at contact point shown in daily chart. Caveat: 161.8 level is still a bit lower on voodoo Fib grid and is acting like a magnet/magnate. Macd has already made contact. RSi not yet. The trendline supports are from 2004 and 2003 respectively and command considerable respect. If they fire, it will be a rocket blast for some good gains, even if it is only for a few days.More as we go. Go salowly."

See 4-hr chart. I had everything pegged and analyzed correctly by conventional TA standards although my EW count was not correct (not a wave iv, but the move was an abc and c was completing), including giving a thunderous warning in my March 3rd post, "Defcon 4 alert for rally"

but what is the outcome? .. only a small position gives only small profits. Still better than nothing, but no question that there is considerable room for improvement here by going in bigtime when stuff I know works, is just about to happen.

But it is funny to see TA working so beautifully.

If I ever write a book in the future it will be called, "the reliability of long-term RSI trendline ignition!"

A nagging difficulty with 3rd of 3rd and 4th waves. Help!


See my attached chart of Nikkei.

This is only for clearing up my misunderstanding/difficulty in the area of 3rd of 3rd and 4th waves.

Which is correct, the count in black/grey or the alt: count in red? Why? ... your reasons, please.

My reason for the alt: red count is that the drop looks like a wave A and is not a 5-er.

One reason I have for the shown count in black/grey is due to my Precter days when I got the impression that 3rd of 3 shows tops on indicators such as Macd, RSi and even on trend strength indicators such as ADX. Then wave 3 gives a slight divergence and then wave 5 gives the ultimate divergence. Additionally, my own observations are that Macd and RSI generate a lower low on wave 4.

I'm fuzzy on this stuff and its quite likely there is an embedded misconception.

Your thoughts/explanations, please?

Wednesday, March 08, 2006

Some thoughts on learning -- students and teachers

There is a world of difference between a conventional self-determined student and one who is pan-determined.

Self-determinism is taking responsibility only & entirely for the self. Pan-determinism, on the other hand, is taking responsibility not just for self, but also for the other(s) involved in the game or venture at hand.

The former is an excellent trait to possess, but it pales in comparison to the latter.

Example: a game of soccer -- each team is only responsible for itself -- but think of the possibilities and permutations/combinations if one could be responsible for BOTH sides of the game -- equally and impartially. There's got to be a winner, but the depth of play will increase exponentially and all manner of art and magic will burst forth -- even in the event of a draw!!!

A close parallel in concept then, between a student and a selected teacher -- generally in life the teacher is selected by other-determinism. That's usually no good.

But when a lean, mean, hungry, determined student himself .... selects the teacher and then takes full responsibility for any perceived inabilities, real or imagined, in the psyche of the teacher, you have a recipe for success because it draws on the magic of pan-determinism.

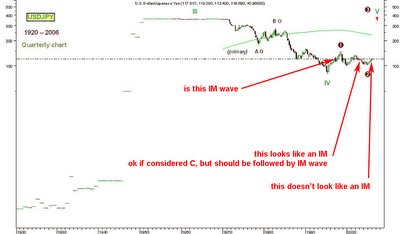
His posts at the graveyard were outstanding, but what I've seen here is magic aborning -- like in the movie "The Black Stallion" -- this desert horse has EW levels of finesse that ain't never been tapped!

No newspaper ads, no magazine ads, no TV, no nothing -- my path crossed his -- in a graveyard; more specifically, at grave #34 -- a Fib number to boot.

A crooked, perhaps very knowledgeable moderator (knowledgeable especially in the realm of cliches -- he knows them all -- verbatim) at the graveyard said to me in a fit of rage; "you'll have blown your account and be gone from Forex within a few months, but I'll still be here!" ...... this moderator apparently makes millions of dollars and controls millions in funds of other companies/individuals etc. Bottomline: I wouldn't learn doodly squat from such a dude even if I paid him a trillion.

For months I was searching the graveyard for a decent broker and I was becoming exasperated. Every time it appeared that I found a good one, I'd run into a ton of negative stuff and would then eliminate the said broker.

I threw my hands up in absolute disgust and despair and fired off a mental distress call -- within a couple days I ran into Idejan's posts and lo and behold, his mention of Alpari; a broker who had not only Forex, but also Futures, USDX and a host of other stuff -- plus MT4 -- then from this same individual I found out that Oanda was also outstandingly good, whereas the graveyard was putting this outfit down across the board. Throw in the EW knowledge he possesses and you dig what I'm getting at?

A man's got to know his own limitations, but he also ought to know the right road when, in a drunken stupor, he stumbles upon it!

Adios amigos

Thank you all

Uh, far from being a classroom material.
I’m more of a intuitive person. I highly depend and trust my intuition. I don’t like constrains, so even when I have a system it is not as systematic as many would prefer. Most of the time it is more like a meditative process than anything else (nothing to do with yoga or any other meditations) and I’m not talking about analysis only.
I like keeping open mind. So while I have a strong attitude and opinions on many things, I’m always completely open and searching for surprises.
I apologize if at parts or possibly the whole video is unclear, specially because it is missing labels, in the next I will try adding labels and edit the video afterward to clear unnecessary delays. I just wanted it to be really live and unedited.
Sometimes we just think or expect that what is perfectly clear for us, will be clear to others too, forgetting that it came to our knowledge from something we have seen, read, heard and digested and based on our previous knowledge. So we need to make sure we communicate that same message to others as clear possible so they have the right message. But I’m not either a teacher or a professional trainer. I’m trying to log my cognitive processes so that others can use it, and perhaps I’ll improve doing that.
This was not my intention and if you find it useful, you should all thank to Joseph.
He insisted my EW knowledge being good enough for others to learn from and is responsible for this video being made. :D
I would not mind if he organizes a seminar on Thailand. I’d be glad to prepare better :D. Or perhaps I’ve ruined my reputation with this video :D

I’m addressing the audio problem and as soon as I finish that I’ll prepare the continuation of the USDJPY analysis including the current development. I’ll also present the other part of my TA, how I’m using one very simple tool, and I present it on that call from 28 Feb.
Stojce will put a link on the right side to a page where you can find all the videos I’ll prepare.
I’ve been told that many visitors from my neighboring Bulgaria and Serbia are coming this day, so a special thanks to all of them for their interest.
ID

Поздрав до сите Форекс пријатели од Бугарија и Србија.
Се надевам дека најдовте нешто корисно овде.
Вашите коментари и прашања се добредојдени.
Дејан

For ID: Thanks, thanks, thanks.

Don't mistake my belated thanks for indifference or ingratitude.

I want to read your posts several times, give it some thought, and assimilate the info before I respond.

A few more days then .......

Adios

EURUSD: details on my wave C (up) call!


Caveat: The market will tell me and you whether I am a shmuck or a sublime lover -- when? .... we'll know soon enough. I'm ready for both outcomes but prefer the latter and have a bottle of Sake ready if the former decapitates my pride.

Let's get on with it then, shall we? See chart. Stoploss line is just below wave 1 beginning @ either 1.1833 or 1.1825.

Wave C has been underway from Feb 27th low of 1.1825 or Feb 28th low of 1.1833.

The current colossal drop is wave 2 down. Don't know whether this wave 2 is a complete abc or whether it is only wave (a) of 2.

Either way I am in and positioned for love or a kick in the ass.

I remember my own writing about the devilishness of wave 2 and how every mother's son expects the previous bearishness to continue. This is the time for the individual to rise above the crowd thinking and walk the road alone, lonely as a son of a gun, with trepidation and his own internal destroyer wreaking havoc on his well-being. Such is life; it can be a bitch during such moments.

I therefore take my stand, hold my ground and wait!

Tuesday, March 07, 2006

USDJPY EW videos

Here are the links of the EW Video Analysis on USDJPY.
It is in two parts, has a low quality audio, but I believe it will do.
I will try the next one to be with better audio.
Here are the links:

USDJPY Part 1

USDJPY Part 2

Tomorrow I will continue with the analysis on the recent Development and since I was asked how I do my calls, I could shortly show that on the last calls from 28 Feb Market update.
It will present the other part of my TA, my MAIDs and my modified RSI.

I sincerely hope you will find this videos useful, I know that labeling would have been a great +, but it would have taken considerably more minutes and would add to the size of the video.
I just hope that you can handle my presentation and I'd appreciate comments and questions.
I once again apologize for the low quality audio, that was the main reason this wasn't published yesterday. Hope to be able to find the best quality to size solution and to clear the interferences that are creating the noise, for the next video.

ID

EurUsd: original call -- wave C up -- still very much alive.

My call of wave C up is unchanged!

Just hammered in some LONG ...... EurUsd at the very lows.

First sign of reversal and continuation north will be greeted by more purchases.

But for now, I'm IN!

Update


Never got the chance to get back in south and my north wave 2 folly got me nowhere, price has found some support back on the bottom tine of our previous daily fork, looking to get back short from a retrace.

Hope everyone's having a great day


Idejan, some good points on wave trading. Thanks.

well, it looks like Im back to being unable to post a pic again (it's blue because i'm sad.)


It's Fixed :) What's a happy color?

EurUsd: 4-hr move from Feb 27th

A samurai weapon -- apply to current EurUsd 4-hr chart rally from Feb 27th.

In Hollyweird it would be called Thunderlips.

aka "Trendline by angle"

Observe that the rally thus far scores 51 degrees angle of ascent, aka angle of attack. I believe virility of this calibre must be respected by all women. The current correction on the 4-hr is therefore a regrouping and recharging of the seminal vescicle.

Can it be a dud? Yeah, in which case it would be tantamount to using Viagra, which in my book, is cheating and earns my scorn. In this event, I be wrong and bow out gracefully.

If wrong, then let it be known that I came so that the Scriptures may be fulfilled!


Testing to see if I can post a picture

Here's the pic of the CAD from earlier.

The compose and edit functions are still kinda buggy.

Euro Update

Idejan and Joseph,

Here’s a couple of screen shots, that show my current thoughts. From last week price has found resistance on the black fork, Thinking this is the 5th that has been discussed earlier, ( I know you two are thinking that this current drop is a corrective wave, and I may agree to a point however I believe that the correction is much larger than shown 5 down, 3 up and 5 down perhaps??)


On the hourly, Don’t faint Joseph, as I mentioned earlier, have been trying to long on a retrace of wave 1. If my thoughts are correct, price will make the red box and reverse south setting up a 3rd wave down, and should be a good one. Price is making a small H&S on the hourly, and if price fails to meet the top of the upward sloping expanding channel ( if will have to storm north to do so) would show weakness in the euro, imo. Might add my north trade has not netted many pipola’s basically trying to catch what I can of the retest to enter south again. Would like to see at least a 50% pull back and will start to scale in longs again. Upper tine of the black pitch fork will be my failure point.

Joseph your C correction may be valid still, as price is still within the two major forks, but so far price has respected the south. One of the two will have to give soon, and price’s direction will be known.

Monday, March 06, 2006

CAD??

Joseph,

Running like the ole' chicken with it's head chopped off today, will post some charts this evening, Idejan was wondering my thoughts on a possible Eur top, but I couldn't help but take a break and post this....

Time for a retrace, but do think we are putting in a bottom, time will tell.

for some reason I can't add a pic, will try to edit later

Finally those EW points

I’m starting with the Note I posted to Joseph on his questions about longer term USDJPY view simply because in my opinion it is the most important thing you should focus when analyzing Charts.

Corrections, can start with both Impulsive action (A and C of a corrections can be IM waves) and Corrective action. But Reversals can only start with Impulsive action, and wave One could be either IM or LD (Leading Diagonal) in both cases the internal structure is 5-3-5-3-5 with the difference - possible overlapping if LD. LDs are rare.

A correction in the above note is …Reversals and Continuations can only start with IM...

When you analyze your charts, what you are interested in is finding OPPORTUNITIES.
First thing to learn in EW even before how to label a chart, should be that the only waves you would like to trade are MOTIVE waves or better said IMPULSIVE ones, and depending on the scale you would either trade the whole moves or only some of the actionary subwaves 1, 3 and 5 of the IM.
This is simply because they are more predictable and provide larger directional moves, thus presenting a better Risk to Reward opportunities (lower Risk to greater Reward potential).
Correctional moves are difficult to both predict and even more difficult to trade.
An exception could apply in cases where A and/or C are IM waves.
Since we all know the basics of EW no point on explaining them, but out of that basics comes a simple conclusion.
Motive waves move in a five wave structures and corrective in a three.
So either way there is a third wave always.
And since you need at least two points to determine direction, that is why the best waves to trade are 3rd waves of an IM and Cs, especially when C is IM itself. This also because ZigZags correctional patterns are prety much same with IM since thay have internal structure of 5-3-5 but the diference is that they are 3 wave structures, so the next 3-5 will not happen and that can full you.

What I will present here is something you all know, and is very very simple, so simple I'm not sure I sould be writing about it. But this in my opinion is the first and most you should know of EW when analysing Markets looking for opportunities.

When we are looking on a chart we are actually looking at/for either:

  • Reversal of the trend
  • Continuation of the trend
  • Or Correction of the trend

(since I was chatting in a room, this took more time to write so I’ll make it short and then explain if there are questions)

  • If we are looking for a Reversal, we will look for a finished IM wave and IM wave started after it but in the other direction (one of a smaller degree). Problem here is because the next returned IM in the other direction could be either wave 1 of the reversal or just a wave A of the correction. That is why it is better to wait for a confirmation.
    Answer on this dilemma lie just below the previous IM end (top or bottom) and after the next IM wave (in opposite direction) is finished the confirmation is above that wave high.

  • If we are in a Continuation, than we want to see a finished IM wave followed by a correction. This is excellent indication for a continuation above previous top (or below bottom)(exemptions are failed or truncated fifths).

  • So as mentioned in previous case, Corrections are only good indication of a continuation of a previous trend. But you can also trade the 3rd waves of the corrections labeled as C waves, as they provide same or similar opportunities as 3rd waves of an IM because they can develop as IM waves too. C waves of the Flats and ZZ must develop as IM waves.

This is the essence, no matter how you label the charts, this is what will give you the most important answers and will help you find the best opportunities on that charts.

I’m preparing a video for USDJPY questions. Link coming shortly after I manage to pack it in reasonable size.

Below is the Joseph's Long Term USDJPY and 3 points of consideration.

On the second (ok if considered C but should be followed by IM... should add ...or followed by D)

Addition to the 4/1 overlapping post should be that overlapping in Impulsive waves is also possible in two special cases: Leading Diagonals and Ending Diagonals, which are type of Triangle formations but with steeper advancing slope. LD could develop in wave 1, and ED in wave 5. Difference between this two are that, while ED have internal structure of 3-3-3-3-3 same as corrective waves, LD have 5-3-5-3-5 IM structure with typical overlapping.

Last calls from 28 of Feb, came out nicely, but unfortunately I was not able to publish a follow up on them.

ID


USDCAD: Look Ma: you told me there'd be days like this!


:) :) this is getting more and more hilarious. Witchcraft! voodoo! What will the fundamentalists say?

But wait, here's a thought -- others feel free to offer some arguments for and against, OK?

so far, textbook bounce off daily macd/RSi trendline support -- in this case the Macd fired first -- but also the FE 161.8%. Currently at FE 100% resistance after also hitting 38.2 fib.

My analysis tells me this is a wave iv and that we've got to go back down for wave v to the 161.8% level @ 1.1300 or thereabouts again.

That will be good temp bottom. This is MHO.

But some of you may feel that the rally is going to just continue and not return to the 1300 area.

Well?

Good news for Forex newbies!

NFA and CME both have started offering free online courses for Spot and currency futures respectively.

Most liquor stores now carry shark repellent. Get some!

You don't need to spend thousands of dollars to learn the Forex. My experience? The best courses are free. Don't burn your capital on junk. Pure Forex books? .... bah!

There are also a couple free e-books that I read when I got started last year. That was plenty enough for me.

Another place I'd recommend is the free Q&A sessions at FXCM -- these are recorded sessions and it will take several days to finish reading them; but it is generally good stuff, with a broad overview of the different pairs and their correlations, if any.

But for your continuing education and actually the creme de la creme, you really ought to download all the issues of CurrencyTrader magazine -- first issue was in October 2004. This is a monthly mag and it will supercharge your forex ammo.

These guys are good -- they even answered my questions meticulously and quoted me twice, thus far, hehehehe. Best news? Its free, baby.

Other advice: low position size, trade less, less, less. Keep it simple and don't go live until you're ready NOT to lose money! Its never OK to be willing to lose money to learn!

Disregard that system selling (3,000 or 3,500 pounds Sterling) moderator shark at Moneytec who has stated very often -- "you must learn to lose money professionally first!"

Goodluck! :)

Wave 4/1 overlap ..... (contd.)

Bear and ID -- good stuff, much obliged.

There you have it; I did NOT know about the overlap being acceptable on smaller timeframes; and I can tell you that I am relieved to read your answers; especially about application in leveraged markets.

So many times I've just flat out rejected a count because I saw an encroachment and then ended up scratching my head for days as I concluded that there just could not be any other sensible count.

Would appreciate ID throwing in a chart example of an actual encroachment on a smaller timeframe, esp. if such occurred on the 4-hr.

Answers to some of the questions

I apologize to all not participating actively this few days.
I'll start with few of the questions and answer others in a while.
Mean while I'm in the ChatRoom so I invite for a chitchat.

  • Remember my trading system? ..... Enter/exit when the head says No, the heart whispers compassionately, Yes -- and the soul demands it!

There are experiments that show men learns (knows) things long before they are aware they know them. Long before conscious mind digest content. But this will take us to unknown territory.
My thought on this is that when we are born we know everything, but then the system makes his best to put us in as smaller box possible, our parents, school, work, are bombarding us with Constrains and we end up knowing nothing.

  • So the obvious question is, "can it ever enter wave 1's territory?" By this I mean, "can any part of wave 4, be it the beginning, middle portion or the end, ever touch or enter wave 1's territory?"

It is not uncommon that wave 4 enters into wave 1 territory in a Leveraged markets and especially in highly leveraged ones. But when so, it is usually on a smaller time frames and for not more then 15% of wave 2 length and for not more than day or two.

  • I knowed we wuz in trubbel when waveid's traffic meter's wave C crossed the 78.6% retracement mark, a plot of land was p-oychased right adjascent to Moneytec's afterlife jumbalaya & 100s of winners popped open the lids of their coffins and in one unified voice screamed, "what the heck is goin on?"

I'll do my best to find more time, but I'm not lacking willingness. I sincerely hope to be able to give more here, and I don't have any problem with how visited this place is. I simply enjoy this small party. Especialy since it gets just about the same regular visits as on MTec.
Wave 2 can last up to nine times the time taken for wave 1 to complete :)
Wave 1 took 1 week.

ID

PS. I’m writing a longer text to explain my points on EW, and it will be published very soon today. I believe that will answer all other questions. Later we can discuss it on a chart.

A can of worms

Joseph,

Your bringing up a question that’s going to start civil unrest. Here’s my take. And it’s just my view, so take it with a grain of salt. I believe that while the (5-3) or 8 wave pattern does define price, the guidelines or rules for wave configuration in highly leveraged markets tend to get bent. I think for the most part the rules remain intact, but when price in on a stampede it can trample down the corral that would normally contain it, ( or overshoot areas that would generally provide sup/res as the high or lows of prior waves.

Also I do not discount the fact of some minor market manipulation when price is trading near levels, there’s a lot of blackbox, system trading, I think there are times when price is near certain levels that price will be pushed to trip the levels of some systems.

I thought that Frost and Prechter mentioned leveraged markets in the book but I am unable to find it this morning, need more coffee…….

In a nut shell, yes I think they can over lap, albeit slightly I can't see wave 4 having lunch with the end of 2 , but more on the smaller time frames. I don’t think this is the norm (need some sort of structure or the whole things useless) just I keep it in the back of the noggin that’s it’s a possibility.

EurGbp: Look at "daily" & thou shalt understand why!


I'll just carry on talking to myself here; maybe the same fella who gave me some water to quench my thirst when I was crossing the desert alone, will return -- this time with some venison, wine and a belly dancer. Dreamin? .. yeah, baby, the heat of the sun will do that to you.

Sunday, March 05, 2006

We've got to get down to serious EW study!

Remember my trading system? ..... Enter/exit when the head says No, the heart whispers compassionately, Yes -- and the soul demands it!

The good news is that this system belongs to each and every one of us natively. Where we differ as individuals is in our ability/disability to nullify/succumb (to) the destroyer (the sole reason for the millions of trading books on the market) who sits betwixt the head and the heart and corrupts and/or deletes messages from the latter 2 -- our allies.


The message is clear -- we've got to dig deep, revisit the basic EW rules, wave structural and aerodynamic theory and practice; dovetailing conventional TA with EW -- the personality and internal character traits of waves, especially the devilishness of wave 2, humiliating capability of wave B and the aborning thrust hinted by wave 4 ..... etc., etc. And of course, let's not forget about fibonacci wave relationships.

This is what we gotta do.

The time has come to get this underway.

I hereby start the ball rolling with a rule about wave 4, that now needs a clarification .....

saw this recently posted on EWI website -- never seen this rule written like this before, but it sure opened up the question ....

"Wave 4 cannot end in wave 1's territory!"

So the obvious question is, " can it ever enter wave 1's territory?" By this I mean, "can any part of wave 4, be it the beginning, middle portion or the end, ever touch or enter wave 1's territory?"

And by touch, I mean, exact price value, wherein the lowest low of wave 4 = the highest high of wave 1 (uptrend).

For this party to get underway, we need a teacher and at least one student. I believe we have a professor and more than one student.

We can't lose! :) :)

Too bad they don’t pay you back when they are wrong.

Signal Services,…………. They flourish with a majority of traders for many reasons but two stand out, imo;

1) Most traders will not take the time to study and learn their craft. The forex markets are the worst, with the low initial deposits and over leverage. The golden apple of instant wealth, get rich quick mentality, permeates thru this industry. People are drawn in with the schemes and then are misled by simple indicator based strategies, when all the arrows point down in the same direction, sell!! #%&@*!………….

There aint no system that will work in every different situation the markets will throw at you, if you take every MA or Stochastic cross, ect. you’ll be in that Commodore Hotel Bar singing them lonely broke blues with all the other Boys.

2) Most traders will not take responsibility for their own trades, at least if they follow a signal service or trade rec. - when their broker makes a margin call, they can blame it on some one else. Well everyone else lost today, I don’t fell so bad. Boy the markets are brutal today, They hunted my stops. The list goes on forever…… Hello!!!! If your having a bad day some else is having the new pool installed.

I’ll crawl down off my soap box…..

Study, learn your profession better than 98% of all the other traders, it’s a tough job - very few will really succeed…………..wonder how many subscriptions I can sell with that??

Scam watch early warning call!

The Money Trader -- a signal service.

Watch out -- you'll be dead and/or broke in 6 months!

Basic rule that has stood the test of time is as follows:

Those who cannot do, teach. Those who cannot perform in industry, become professors.

Trading is hard; only the tigers survive and even they have to be ever vigilant!

Signal\newsletter etc. providers cannot trade themselves; their only source of income is from your funds.

My personal experience with the Forex is that everything of bountiful, exquisite value came to me just like god-given gifts, such as air, water and love. No money was involved.

There are hundreds of signal providers around, but what makes this particular one lethal to your pocketbook is the dual famous names, Kathy Lien and Boris Schlossberg.

Both are technical writers for FXCM & Kathy has just written a book on FX trading.

I believe this service is not related to or connected to FXCM, but it is entirely possible that it is a strategic attack at the millions of wildebeast.

They want $1,500 per year for their signal service.

Having read their stuff for a few months at FXCM's website I can unequivocally state that both are terrible market timers.

Both are decent enough writers of technical points, but I believe an average technician, working on his own, can do far better.

Its getting so a Forex newbie can't even go to the can in peace anymore without some asshole taking a shot at his goodies!

:) :)

Waveid\blogspot crossed 78.6% retracement? :)

:) :)

I knowed we wuz in trubbel when waveid's traffic meter's wave C crossed the 78.6% retracement mark, a plot of land was p-oychased right adjascent to Moneytec's afterlife jumbalaya & 100s of winners popped open the lids of their coffins and in one unified voice screamed, "what the heck is goin on?"

This wave 2 down is brutal; and wave B of this 2nd wave even tricked a truckload of dead people; this is a new development in wave theory, for the dead are supposed to be left alone and respected. Wave C seems to have whacked the living on their heads with a saucepan.

This is not good; it was already not safe to go to the can in peace anymore; now the graveyard too?

What will be the trigger for firing off wave 3 up?

-----------------------------------

Two waveid fellas were walking home after a party and decided to take a shortcut through Moneytec just for laughs. Right in the middle of the cemetery they were startled by a tap-tap-tapping noise coming from the misty shadows. Trembling with fear, they found an old man with a hammer and chisel, chipping away at one of the headstones.
"Holy cow, Mister," one of them said after catching his breath, "You scared us half to death -- we thought you wuz a ghost! What are you doing working here so late at night?"
"Those fools!" the old man grumbled. "They misspelled my name!"