Nice confluence to USD view gives a look at GOLD chart and the CrudeOil chart.
Gold is about to finish a wave B up around 632.80<>636.45 to continue down to somewhere around 500.00<>437.50 probably 449.20
I expect same with Crude Oil, which could top somewhere around 76.56<>78.13 and correct down to around 50.00
This could be considered US Dollar positive.
idejan
Thursday, July 06, 2006
AUD
AUD
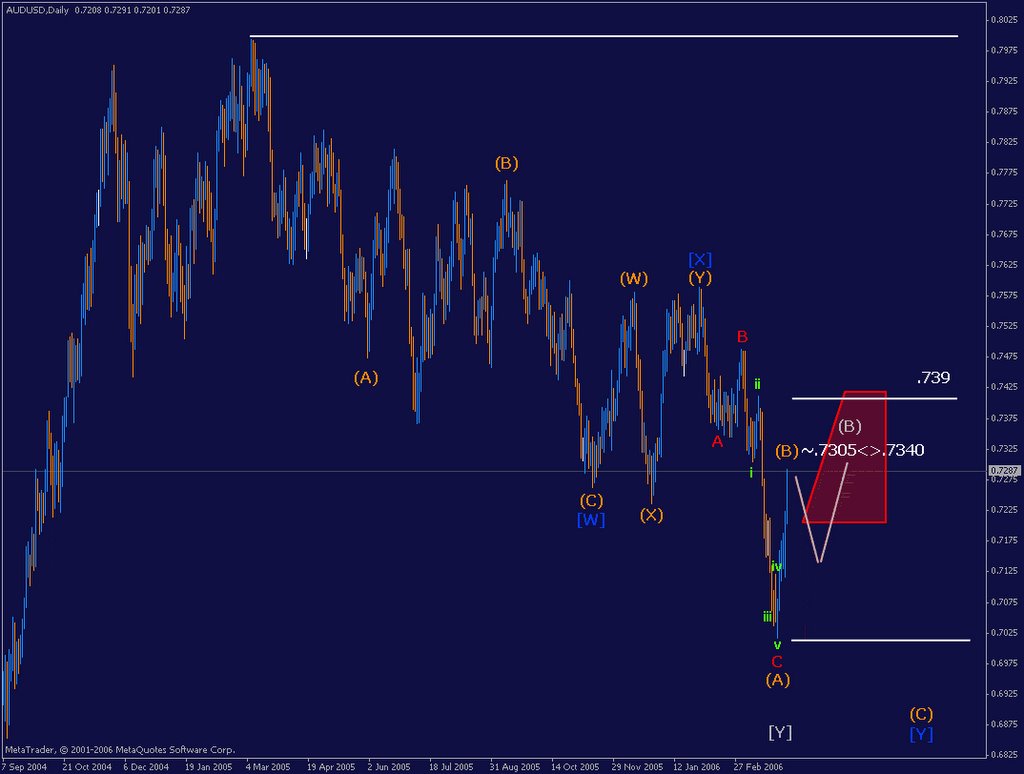
if it breaks (very possible) above 0.7460 and 0.7472 it will most probably target 0.7477/7507 to continue down... just broke above 0.7460
let see...
ID
if it breaks (very possible) above 0.7460 and 0.7472 it will most probably target 0.7477/7507 to continue down... just broke above 0.7460
let see...
ID
USDJPY takeoff level
Look for a possible USDJPY takeoff somewhere from around 113.80/50/00
It will need to break below 109 to negate my view, but breaking below 113 would get my attention.
Immediate break above 116 confirms next upper targets.
ID
It will need to break below 109 to negate my view, but breaking below 113 would get my attention.
Immediate break above 116 confirms next upper targets.
ID
Update July 6th, 2006
Short update on EURUSD
It is a closer look on what was presented on that picture few days ago.
As I said before, we see a possible ended B, but on the other detail I'm presenting a possible scenario where B is still on...
On the next chart we see that scenario, which I believe is very possible, some more stop hunting before the big dive down in the next C down to finish (A) in the target area shown on the above picture.
However, a significant break below that target area for wave [b] could seriously argue about wave B being fiished, and the break below the bottom of wave A will confirm we are in a wave C down.
Take care,
idejan
Tuesday, July 04, 2006
Short Update
AUD did not made it to lower levels but instead made a retracement right from the levels at the time of the previous post, and right into the posted target area of 0.7400/50 (actual high 0.7458) (see sumary below)
EURUSD
..."If so, then we can expect wave [b] to target 1.2640 to 1.2780 but probably 1.2664<>1.2717 to continue down in a wave [c] to finish first Minor wave A down, probably to 1.22/21 possibly lower to 1.1960/20."...
Finished little above the target area, and now it could be a finished wave [b] as suggested, or it could be just the first wave (a) of that [b], which would mean more sideways to up movement (or more precisely, wave (b) down then wave (c) up to finish [b]).
(see sumary below)
USDJPY
no point updating since I notice that I missed publishing intraday targets for the correction I was forecasting (...I believe that we are about to see a retracement in a wave [b] Minute of the first Minor wave A...)
(see sumary below)
NZDUSD and USDCAD last post still valid nothing to add and I'm sorry I don't have time posting shorter term on this pairs.
Summary
So in general, it is quite possible that recent correction in USD pairs (USD depreciation) could not be finished and could test the previous levels (highs/lows respectively in different pairs), but it would be just what my friend Joseph used to say "a sucker B" which would not travel beyond last tops/bottoms.
See previous picture of EURUSD we are in that unlabeled small red retracement wave [b] up before the next [c] drop down to finish wave (A) (blue).
Hunt this top from the current levels with tight stops, or from little above, than either ride all the way down, or take some profit at the end of wave (A) leave the rest for the ride down, and then add again at the end of wave (B) (again hunt it with tight sl)
There are many considering a 5th wave up, but sorry I can't agree with it. If somebody shows me how can we label that wave 1 (substructure) I would retreat me stand. But I can't even agree with the sub structure of wave 3 being acceptable for labeling it wave 3. I'm talking about the whole move up from Nov low to May high, somebody considering it a possible IM wave up and expecting a continuation in a wave 5.
Best to all,
ID
Thursday, June 29, 2006
Market Direction Jun 28
AUD
Pay attention to 0.7220/00 for a possible retracement to 0.7400/50 before it continues down to min. of 0.6860<>0.6600 to finish the whole correctional pattern from march 2005 and continue up to min 0.9 possible target zone from 0.88<>0.98.
Immediate move above 0.7335 could indicate possible minute bottom at 0.7269 for a retrace to mentioned .7400<>.7450
EURUSD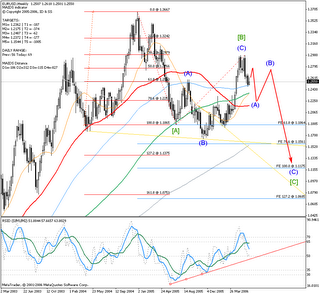
Current bottom at 1.2478 is right in the box for a D3 (Double three) (y), both by time and price, so we have a very possible finished Minute [a] and a started wave [b] of the first Minor wave A down of a larger intermediate (A) (possibly it could be that we should use one degree higher for all waves and it will finish a Primary [C] wave).
If so, then we can expect wave [b] to target 1.2640 to 1.2780 but probably 1.2664<>1.2717 to continue down in a wave [c] to finish first Minor wave A down, probably to 1.22/21 possibly lower to 1.1960/20.
Larger Intermediate wave (A) (or Primary [C]) to target min 1.15 but possibly lower to 1.1<>1.09 even 0.9 but I'm not that bullish on Dollar yet :). Let market give us clues step by step.
*forgot to add this on the chart: wave [b] is right to the pip on the 61.8 fib of wave [a] and just a little above 161.8 fib extension of (A) from the (B) for the wave (C) of that [b].
USDJPY
Well my upper target level was overshot by some 60 pips (115.70/116.10) and now looking from the 109 bottom it is into the upper target area for a finished pattern, but looking on the last sub wave pattern it shows a possibility of extending higher to 117.5/118/118.5, but I don't expect this to happen, and I believe that we are about to see a retracement in a wave [b] Minute of the first Minor wave A of a larger Intermediate (Y) to finish a Primary wave [A] around 128<>145 by the end of the year. It is the first leg of a wave c Cycle correction of the Supercycle correction wave (b) from April 1995 bottom which is to finish in the next 3 years into 144/170/190/210 target area, which is looking way too far into the future :) and we better let market guide us. Temptation :)
(I'm aware the pictures would have been much clearer, but patience please.)
NZDUSD
Attention required. It is into the most probable target area so we can have a finished drop here, but it could finish lower as I published, around 0.586.
Questions remain to be answered:
- will this finish the whole pattern and we are to see a continuation up?
- or it will finish just the first wave of larger correction, so we will see a 3 wave correctional wave [B] up and then wave [C] down?
I hope to be able to have that answer very soon. The structure of the next move up will give us some clues.
USDCAD
just shortly
If we stick to the view that the drop from Jan 2002 top is IM wave down then we have more on the downside as I've published in some of the previous posts. Or below 1.0000
If we consider that Currencies don't develop IM wave of a SuperCycle degree, or that they tend to move sideways, then USDCAD could be ready for a reversal up. A move above 1.18 would certainly be a very good argument for that.
Anyhow, we can expect to see a move to 1.14<>1.15 before we can decide on a most probable scenario. A break above this area will be a good indication that we could have a longer term bottom formed.
Of course, a break below the 1.093 bottom will confirm my expectation that we could see USDCAD much lower, 1.06<>0.9
Not in a shape yet. It took me too much time preparing this, it is late and I'll leave GBP and Gold for some other post.
Take care all of you there
idejan
Pay attention to 0.7220/00 for a possible retracement to 0.7400/50 before it continues down to min. of 0.6860<>0.6600 to finish the whole correctional pattern from march 2005 and continue up to min 0.9 possible target zone from 0.88<>0.98.
Immediate move above 0.7335 could indicate possible minute bottom at 0.7269 for a retrace to mentioned .7400<>.7450
EURUSD

Current bottom at 1.2478 is right in the box for a D3 (Double three) (y), both by time and price, so we have a very possible finished Minute [a] and a started wave [b] of the first Minor wave A down of a larger intermediate (A) (possibly it could be that we should use one degree higher for all waves and it will finish a Primary [C] wave).
If so, then we can expect wave [b] to target 1.2640 to 1.2780 but probably 1.2664<>1.2717 to continue down in a wave [c] to finish first Minor wave A down, probably to 1.22/21 possibly lower to 1.1960/20.
Larger Intermediate wave (A) (or Primary [C]) to target min 1.15 but possibly lower to 1.1<>1.09 even 0.9 but I'm not that bullish on Dollar yet :). Let market give us clues step by step.
*forgot to add this on the chart: wave [b] is right to the pip on the 61.8 fib of wave [a] and just a little above 161.8 fib extension of (A) from the (B) for the wave (C) of that [b].
USDJPY
Well my upper target level was overshot by some 60 pips (115.70/116.10) and now looking from the 109 bottom it is into the upper target area for a finished pattern, but looking on the last sub wave pattern it shows a possibility of extending higher to 117.5/118/118.5, but I don't expect this to happen, and I believe that we are about to see a retracement in a wave [b] Minute of the first Minor wave A of a larger Intermediate (Y) to finish a Primary wave [A] around 128<>145 by the end of the year. It is the first leg of a wave c Cycle correction of the Supercycle correction wave (b) from April 1995 bottom which is to finish in the next 3 years into 144/170/190/210 target area, which is looking way too far into the future :) and we better let market guide us. Temptation :)
(I'm aware the pictures would have been much clearer, but patience please.)
NZDUSD
Attention required. It is into the most probable target area so we can have a finished drop here, but it could finish lower as I published, around 0.586.
Questions remain to be answered:
- will this finish the whole pattern and we are to see a continuation up?
- or it will finish just the first wave of larger correction, so we will see a 3 wave correctional wave [B] up and then wave [C] down?
I hope to be able to have that answer very soon. The structure of the next move up will give us some clues.
USDCAD
just shortly
If we stick to the view that the drop from Jan 2002 top is IM wave down then we have more on the downside as I've published in some of the previous posts. Or below 1.0000
If we consider that Currencies don't develop IM wave of a SuperCycle degree, or that they tend to move sideways, then USDCAD could be ready for a reversal up. A move above 1.18 would certainly be a very good argument for that.
Anyhow, we can expect to see a move to 1.14<>1.15 before we can decide on a most probable scenario. A break above this area will be a good indication that we could have a longer term bottom formed.
Of course, a break below the 1.093 bottom will confirm my expectation that we could see USDCAD much lower, 1.06<>0.9
Not in a shape yet. It took me too much time preparing this, it is late and I'll leave GBP and Gold for some other post.
Take care all of you there
idejan
Sunday, June 18, 2006
This could be the right time to buy USD!
Hello everyone,
It's been quite some time since my last post, and I thank all of you that were digging this blog all this months making it being of some use.
I just sent email, that I'm republishing here, to my dear friend Joseph and I thought you should know too that in my opinion we are sitting on a critical juncture...
Any way, it was Joseph who draw attention to this juncture early at the begining of the year.
Here is the message:
Hi Joseph,
I just updated my data and opened my charts to see what was happening while I was gone. I'll need some time to get back into the zone.
First, just a short on EUR and once again my feeling is that it is impossible to see EURUSD going above 1.3
So, the recent top could be it, and we could be in a wave c down of a larger degree (intermediate). That could be a hell of a ride down.
1.15 min. but way down to 1.11<>1.09 if not lower.On a smaller time frame, we could be in a Minor wave A down of the larger c down, with first smaller wave A of that minor A finished with this last drop. This recent move up is to give more answers but I can see it's target around 1.2700/50 being a nice shorting opportunity. Of course it could retest the top above that. I'm not very found to EUR this days.
But on the other hand, you know my favorite is JPY so I am putting a little extra effort into it. This recent move up on an hourly is to finish 115.70/116.10 to finish first wave up of a continuation up in wave y of larger wave a to 128<>145 probably 128.7/134/140.9/143.65 by the end of the year. It would finish that first wave a of a larger wave (y) up to 144/170/190/210 to finish in the next 3 years. So, the next small correction down would provide excellent risk to reward opportunity to buy USDJPY, around 113.4/113 for those that missed the opportunity to enter lower.
AUDUSD down to .68<>.66; NZD .5860<>.5260 (a slight chance that it could go up to .64/.66 (.6530) first); SGD not clear with this one but it is right in the box (both by time and price) for a finished larger correction and possible continuation up or at least a second leg up to around 1.8<>1.9 but you should know better on this one :)
Buying the next dips in most of the USDxxx pairs for a nice ride up could be a good advice. :) (opposite in xxxUSD pairs of course)
Of course it does not apply to CAD and you know my view on it :)
I will need some time to recover and to see if I will be able to keep posting at some decent pace.
Once again, thanks to all of you.
Take care,
ID
Tuesday, April 18, 2006
Announcement
Hi
I see that few still visit this blog although there are no regular updates.
I just want to inform all of you that I won't be publishing any new updates at least for a month.
Best regards to all of you,
IDejan
I see that few still visit this blog although there are no regular updates.
I just want to inform all of you that I won't be publishing any new updates at least for a month.
Best regards to all of you,
IDejan
Sunday, April 09, 2006
USDCAD
 Here is my longer term view on Canadian Dollar, the one in blue is published before and the green one is the alternative one.
Taking only the drop from may 2006 it indicates possible not finished pattern(s) with more to the south. SO no matter what the longer term view is, intermediate view is still down to probably 1.1 if not 0.9
However, this pair has been delivering a lot of surprises, so I would not rule out that green alternative and a possible Minor move up to finish that green (x).
Crude made much higher than I expected, but it is still into the channel.
My view on Crude is down to $50/b, but as Joseph pointed in one of his myth busters episodes, it depends how you see CAD correlates with Crude...
ID
Wednesday, April 05, 2006
AUDUSD
 This is a possible Intermediate view on AUDUSD.
Alternative in gray indicates possible finished correction and possible continuation up.
I however expect little more on the downside. Possibly .6958/48 to .6729
ID
Subscribe to:
Posts (Atom)