EURUSD up to min 1.28515 to probably higher - 1.34511<>1.42207
Tuesday, July 28, 2020
EURUSD
Friday, January 03, 2020
Sunday Notes 3 Jan 2020
ALK
MSE (Macedonian Stock Exchange) for some time now is getting some movement and broke important resistance levels giving room for bullish thinking.
Short forecast for ALK
ALK up into 13209<>14550 target zone to correct down to max 9926<>8497 (bellow that possible reconsideration) up at 19625<>24295<>37796.
Any break bellow 6700 will negate bullish views and open alternative view.
BTCUSD
did not played that previous post bullish view, and more than just not getting confirmation for uptrend scenario, BTC at the moment giving more signals to the down side than to the upside.
Probability of testing the 5470 level rose significantly. Fall below 6477 to confirm 5470 target.
At the moment development and the structure of the movement from previous 6477 low does not indicate possible development for a reversal up but suggests continuation of the correction down. Any movement up should be contained bellow 7842.
Just break above 13764 will confirm uptrend, break below 3224 will definitely negate the UPtrend scenario and confirm we have final leg of the larger correction down from the all time top at 19891 still in place and a serious weakness of the BTC.
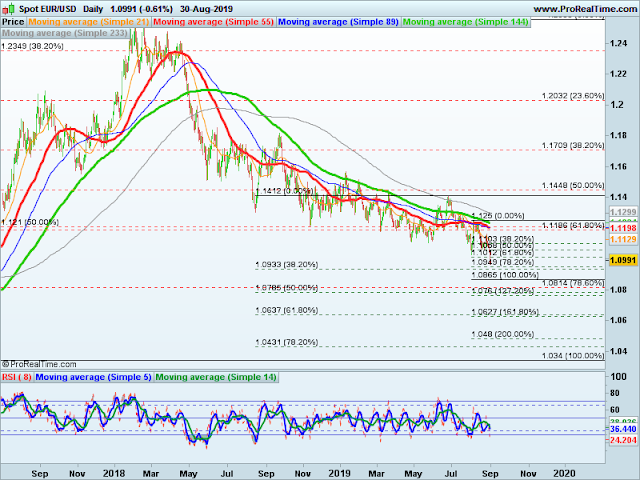
EURUSD
played well from previous post, it finished the correction right after the posting and developed fairly good structure to confirm possible reversal up as I forecast, but still far from definite confirmation. Should stay above 1.09812 not to negate possible reversal up. Any break below (even 1 pip) will negate reversal and will indicate continuation of the correction down to previously mentioned levels 1.0865<>1.0814<>1.076. Cautiously bullish at the moment. We need to closely monitor development for more definite indications.
DISCLAIMER Trading involves high degree of risk. Past results are not indicative of future returns. idejan assume no responsibilities for your trading and investment results. All published here is for educational purposes only and should not be construed as investment advice. I tend to obtain Information from sources believed to be reliable, but I do not warrant its completeness or accuracy, or warrant any results from the use of the information. Your use of the information published here is entirely at your own risk and it is your sole responsibility to evaluate the accuracy, completeness and usefulness of the information. You must assess the risk of any trade with your broker and make your own independent decisions regarding any securities mentioned herein. © Copyright Dejan Iliev 2019
MSE (Macedonian Stock Exchange) for some time now is getting some movement and broke important resistance levels giving room for bullish thinking.
Short forecast for ALK
ALK up into 13209<>14550 target zone to correct down to max 9926<>8497 (bellow that possible reconsideration) up at 19625<>24295<>37796.
Any break bellow 6700 will negate bullish views and open alternative view.
BTCUSD
did not played that previous post bullish view, and more than just not getting confirmation for uptrend scenario, BTC at the moment giving more signals to the down side than to the upside.
Probability of testing the 5470 level rose significantly. Fall below 6477 to confirm 5470 target.
At the moment development and the structure of the movement from previous 6477 low does not indicate possible development for a reversal up but suggests continuation of the correction down. Any movement up should be contained bellow 7842.
Just break above 13764 will confirm uptrend, break below 3224 will definitely negate the UPtrend scenario and confirm we have final leg of the larger correction down from the all time top at 19891 still in place and a serious weakness of the BTC.
EURUSD
played well from previous post, it finished the correction right after the posting and developed fairly good structure to confirm possible reversal up as I forecast, but still far from definite confirmation. Should stay above 1.09812 not to negate possible reversal up. Any break below (even 1 pip) will negate reversal and will indicate continuation of the correction down to previously mentioned levels 1.0865<>1.0814<>1.076. Cautiously bullish at the moment. We need to closely monitor development for more definite indications.
DISCLAIMER Trading involves high degree of risk. Past results are not indicative of future returns. idejan assume no responsibilities for your trading and investment results. All published here is for educational purposes only and should not be construed as investment advice. I tend to obtain Information from sources believed to be reliable, but I do not warrant its completeness or accuracy, or warrant any results from the use of the information. Your use of the information published here is entirely at your own risk and it is your sole responsibility to evaluate the accuracy, completeness and usefulness of the information. You must assess the risk of any trade with your broker and make your own independent decisions regarding any securities mentioned herein. © Copyright Dejan Iliev 2019
Sunday, September 29, 2019
Sunday Notes 29 Sep
More than a year ago I started forecasting BTCUSD for a friend in a series called Sunday Notes written in Macedonian sent in a private chat on Viber.
I am now continuing to follow BTCUSD here.
BTCUSD
In the previous posts to my friend I wrote that BTC is in a correction to a zone of 9730<>8490<>7240 and I also forecast that second leg will be contained in the 11115<>11662 up to 12358 (on 29 Jul ). It made it's high at 12325 to start it's final leg of correction down to the lower zone, and as I wrote in the following message (from 2nd of Aug) it will most probably go to 7240.
Now, the fall to 7240 is in it's final approach and the correction will most probably finish there to continue up to first break 13764 and then the all time high at 19891 (Bitfinex) to continue up to min target zone of 24278<>34818 (base on assumption that correction ends at 7240. An update of this levels after finishing of the correction).
Fall below 7240 wont negate this scenario but will indicate weakness. Fall below 5470 will raise serious doubt and open door to completely opposite development, and the break below 3224 will definitely negate the UPtrend scenario and confirm we have final leg of the larger correction down from the all time top at 19891 still in place and a serious weakness of the BTC.
At the moment I am more inclined to the UPtrend scenario.
EURUSD
Almost touching (40 pips above) the upper level of the forecast zone from previous post (1.0865<>1.0814<>1.076) and not showing definite signs of finished correction and reversal up at the moment of writing, but needs to be monitored closely.
It will very possibly finish the correction in the next few hours to a day to continue up above Feb 2018 high of 1.2555.
NOTICE: These are not Trade recommendations or advices and I don't accept any responsibility what soever.
Sunday, September 01, 2019
Sunday Notes EUR/USD
EURUSD to finish correction down to most probably 1.0865<>1.0814<>1.076 to continue up above feb 2018 high of 1.2555
Continuation lower than said levels would most probably negate this view.
Continuation lower than said levels would most probably negate this view.
This email was sent to you by Dejan Iliev through the ProRealTime workstation.
Wednesday, September 14, 2016
MSE ALK
Retrace to 5,200<>5,150<>5,090
ALK to retrace to 5200<>5150<>5090 to continue up above 5500 probably to 6079<>6270<>6579 target area.
МСЕ АЛК надолу до 5200<>5150<>5090 за потоа да продолжи над 5500 најверојатно до зоната 6079<>6270<>6579.
МСЕ АЛК надолу до 5200<>5150<>5090 за потоа да продолжи над 5500 најверојатно до зоната 6079<>6270<>6579.
Monday, March 16, 2009
Dow Jones reversing?
Did DJI hit the bottom?
It's on my target from previous post 6840<>6550<>6040, low @ 6469.95 (source Google Finance) and developing a structure that could indicate a very possible reversal i.e. formed bottom and beginning of a new uptrend cycle.
ID
NOTICE: This are not Trade recommendations or advices and I don't accept any responsibility what soever.
Sunday, January 04, 2009
End of THE Recession?
Hi there,
I wrote this to a friend of mine a week ago and it's something I had in mind for some time.
I took a look at the Dow and I searched to find a chart of adjusted Dow for it's real value (represented in Gold) but I found just this chart of inflation adjusted DJ which is probably very similar picture.
 As you can see, while the DJIA (blue line) made new high at the beginning of 2007 the adjusted Dow (red line) never made it so high.
Based on the adjusted DJIA chart, it is quite possible that we are living the last leg of the larger correction that started 2000.
:)
Just to cheer you up.
There are some other indications supporting this view. IMHO we need to wait for just a few months more to see the developing.
On my charts from few days ago, you'll see I forecast DJI to go up to 10,200 (it's not actually shown but it can be seen based on the fib ext tool points...) before it dips possibly to end this correction down to 6840<>6550<>6040.
As you can see, while the DJIA (blue line) made new high at the beginning of 2007 the adjusted Dow (red line) never made it so high.
Based on the adjusted DJIA chart, it is quite possible that we are living the last leg of the larger correction that started 2000.
:)
Just to cheer you up.
There are some other indications supporting this view. IMHO we need to wait for just a few months more to see the developing.
On my charts from few days ago, you'll see I forecast DJI to go up to 10,200 (it's not actually shown but it can be seen based on the fib ext tool points...) before it dips possibly to end this correction down to 6840<>6550<>6040.
 If this is correct EW (Elliott Wave) count than we can expect developing of a new UP trend very soon... :)
Few months ago I said I expect Dow Jones US Home Construction Index to end it's fall, and it now shows some indication of a possible reversal. This supports previously said, but it will take time to be confirmed. (.DJUSHB on Google Finance you can see a possible IM - Impulsive wave 1 up finished....)
I was doing some analysis on few Forex pairs, but still far from being in shape. I mainly look for short term moves, still trying to grasp the bigger picture.
(still considering few options for my future posts
If this is correct EW (Elliott Wave) count than we can expect developing of a new UP trend very soon... :)
Few months ago I said I expect Dow Jones US Home Construction Index to end it's fall, and it now shows some indication of a possible reversal. This supports previously said, but it will take time to be confirmed. (.DJUSHB on Google Finance you can see a possible IM - Impulsive wave 1 up finished....)
I was doing some analysis on few Forex pairs, but still far from being in shape. I mainly look for short term moves, still trying to grasp the bigger picture.
(still considering few options for my future posts
 As you can see, while the DJIA (blue line) made new high at the beginning of 2007 the adjusted Dow (red line) never made it so high.
Based on the adjusted DJIA chart, it is quite possible that we are living the last leg of the larger correction that started 2000.
:)
Just to cheer you up.
There are some other indications supporting this view. IMHO we need to wait for just a few months more to see the developing.
On my charts from few days ago, you'll see I forecast DJI to go up to 10,200 (it's not actually shown but it can be seen based on the fib ext tool points...) before it dips possibly to end this correction down to 6840<>6550<>6040.
As you can see, while the DJIA (blue line) made new high at the beginning of 2007 the adjusted Dow (red line) never made it so high.
Based on the adjusted DJIA chart, it is quite possible that we are living the last leg of the larger correction that started 2000.
:)
Just to cheer you up.
There are some other indications supporting this view. IMHO we need to wait for just a few months more to see the developing.
On my charts from few days ago, you'll see I forecast DJI to go up to 10,200 (it's not actually shown but it can be seen based on the fib ext tool points...) before it dips possibly to end this correction down to 6840<>6550<>6040.
 If this is correct EW (Elliott Wave) count than we can expect developing of a new UP trend very soon... :)
Sunday, October 07, 2007
Well I wanted to preserve some of my first writings I published at MoneyTec forum in my first thread opened there called My Elliott Wave Charts.
Somehow I find it more safe here than in my computer :)Any way I only recently copied my posts with ease, keeping the original formating, thanks to Google Notebook.
Here are my posts from mid 2005.
Very best to all
idejan
PS. At the time I wrote those posts below, I was not very familiar with Iris's work and consequently, with his understanding of Fundamentals.
Anyway, although I later understood what he means by Fundamentals (He practices Gann among other methods)(and not that I agree with him even now anyway), I am grateful that I was inspired with his awkward stile of writing to write this ramblings on the psychology and forces behind Markets.
So thanks to Iris and his MoneyTec thread and also thanks to Noor, who always stood there to defend Iris...
ID Elliott Wave & Forex Writings
My Elliott Wave Charts Thread
My Elliott Wave Charts - Page 2 - MoneyTec Traders Community ForumRecently I've published a post disagreeing with Iris and what he said about the Fundamentals -
Quote:
| Originally Posted by Iris "...expectations do not set Long Term Price levels...Fundamentals do..." |
But since it is an interesting subject (fundamentals) I've decided to paste my previous post from Iris's thread here, with a little follow up example.
Quote:
| Originally Posted by idejan Hi Iris, Although I admire your work very much, I could not agree on this with you. Actually what you read (fundamentals) today, usually is a report for a period of at least one month before. What happened that month is a consequence of something that occurred 3-6 months before (if not more)... Expectations (desires, hopes, dreams beliefs etc. - the social mood) produces behavior which produces results (measured with - fundamentals). How can possibly someone explain why on stellar good reports dollar did not react (or did negatively) and opposite on that we've seen huge moves on weak and bad data? (and not only $US) You've all probably heard before a one word explanation - HERD, CROWD. MASSES... What I agree with you is that we are on a juncture (which I believe is to be a bit higher @ 1.2450/95) to go south to 1.2297/63 (my time projection was 5-9 but few days more would be acceptable for me) . *(thanks to Iris I've started learning more about time) Best to all and don't give any PIPs back, ID |
If however we were in a bar, and you'd ask me which one of the two girls sitting at the other side of the bar I'd prefer, the blond or the brunette, (I'd most probably said both, but) I'd said I prefer blond. On the other hand if I was to give you a rational answer, I'd probably said that I'd consider face, body, length of their legs... and other attributes
Oops, I did not mentioned some fundamentals like intelligence... it's definitely the beer.
ID
*but then again it's only me being impressed with social phenomenas...
and only if people were rational beings...
My Elliott Wave Charts - Page 2 - MoneyTec Traders Community Forum
Hi everybody,
Inspired with the latest posts in one of my favorite threads, Trading Eur/Usd with uncle Elliot, I decided to post my opinion on something I've mentioned in my previous posts, and that's my opinion about trading Elliott Waves on different time frames.
Part of what I've posted in mentioned post was:
Quote:
| Originally Posted by idejan The best advice I can give is that Elliott doesn't works that good on small time frames and for scalping. (it works but it requires a great great experience, and if you could do it people will probably call you NEO |
If you are too close to, or in the crowd, you could not possibly see the crowd, how it behaves and which direction it goes. You will see those near you, their moves, emotions etc.
E.g. From the view point of an antelope there is no particular direction where it's heading when it starts running, since it follows the first next to it. It doesn't even knows why's doing that at the moment, or if it's wise thing to do. But it is not really important how wise it is, since their primal part of the brain sends an impulse which says "preserve". Preserve life. Their trail is zig zag and seem quite confused (doesn't those moves on a 1 min charts on important announcements seem similar?).
But if you pull out and lift your camera above the herd, you are starting to get some direction. And going even further above you don't see all those small zz all those antelopes in the herd are doing, but you'll see the HERD going in some pointed direction.
Traders primal instinct says preserve too. They need to preserve their money.
Isn't that an example.
But in fact, it is a good example.
So, it is my humble opinion that EW works best on Daily charts, since it filters all those small moves, using Hourly for checking sub-waves and determining the confirmation - invalidation levels (S/L below invalidation).
ID
My Elliott Wave Charts - Page 3 - MoneyTec Traders Community Forum
Market Essentials
Again something that I've posted at Iris's thread and I'd like to comment more than it's possible or appropriate at his thread.
and here it is accompanied with the additional comments:
Here is that part on The terms Fundamentals and Expectations:
I'm getting very annoyed with the implied meaning to the "Fundamentals" as being THE FUNDAMENTALS. Economic indicators are just a numeric representation (and not accurate but more of a trial representations) to RESULTS in the ECONOMY which it self is a one of the pillars of the society, since trough the "actions" of man in the "economy" he can fulfill one of it's FUNDAMENTAL NEEDS (the need for material necessities - food, cloths etc for himself and his family - or Economic security and safety). So the indicators are not FUNDAMENTALS.
As for the EXPECTATIONS, I've used them just because of the relation to the previous posts, and they are in fact (dreams, hopes, desires etc.)
One have NEEDS, then one Dreams, Hopes, Desire about fulfilling those NEEDS. These are the essence of the MOTIVATION. However the innate capacity to do or be (ABILITY) determines if the one will take some ACTION to fulfill his DREAMS, HOPES (explanation: while dreams are unlimited expectations full of "what ifs", Hopes require a "desired expectation" or the expectation that something will happen if nothing goes wrong) and DESIRES (explanation: the awareness that something better exists). It is the convergence/divergence of the DREAMS, HOPES, DESIRES vs ABILITY that creates HAPPINES or FRUSTRATIONS.
The simple fact is that all animals including humans, primal NEED is to SURVIVE, to continue to live. To do that they need to take actions. Trading Markets is one of the ACTIONS people trade to profit in money, to be able to fulfill their Dreams, Hopes, Desires - related to their NEEDS. It is how GREED could manifest it self in the trading. On the other side is the FEAR (of loss). It is a manifestation of the FEAR concerning ones Economic security and safety, connected with the PRIMAL INSTICT to SURVIVE (continue to live, preserve life) and it is why the FEAR is so sincere and strong emotion.
NOTE: I'm not a psychologist.
and here it is accompanied with the additional comments:
Quote:
| Originally Posted by idejan Originally Posted by Iris Hello Noor and Everyone....... ... The Markets Price expectation will always revert back to the Fundamental of Time...today's a good example ... __________ Yes I agree, it will eventually. But the thing is, that while forecasting markets gives a room and comfort of being wrong until it does (price reverts), trading markets doesn't. If ones stops are being hit every day for a time period of a day(s), week(s), month(s), chances of one being drawn down, grows with his/hers continuing "expectation" that the Price will at some point "revert back to the Fundamentals of Time". So, it could always prove that ones anticipation should revert back to the Fundamentals of Time, rather than waiting the Price to do that. Especially if Time and Price are correlated and in a some kind of an agreement _______________ Originally Posted by Iris Time has Curvo-Linear Wave properties...and they do repeat...Price is a mathmatical numeric that exists within and must conform to the structure of Time because they operate within the same constants and variables _______________ than it could be that they never disagree (diverge), but it's our expectations about the Fundamentals, that are in a disagreement (both with time and price). _______________ Originally Posted by Iris ... In regards to disparities between them or "Fog" the Markets Price expectation will always revert back to the Fundamentals of Time calculated thru the Technical of Price...for that is how a Trend continues or reverses course to its true value... _______________ And to the point. Markets Price expectation will never revert back to the Fundamentals of Time, since the PRICE is THE EXPECTATION(S). It is the Aggregate Expectation and Agreement of the MASS (even those not trading, since their expectations influence Fundamentals etc.) Market Price expectations, the PRICE, will never revert back to the "Fundamentals of Time", since it is ahead of them in time. Ultimately it is the Fundamentals that will at some point of time show up to reflect the results of the ACCUMULATED EXPECTATIONS or "Social Tendencies - Behavior". As for the ______________ Originally Posted by Iris ...today's a good example ... ______________ The price before the announcement was trading in a range from 1.2449 to 1.2485 (36 pips) and just before the announcement was somewhere @ about 1.2465 HIGH. In the next 30 minutes, it fell down to 1.2381 LOW (84 pips) to get to 1.2445 (64 PIPs or 76% of previous move) in the next 5 and a half hours. Previous trading day low was around 1.2375 and high at 1.2475 (100 Pips) with a closing just a few pips below the previous high. The Average day move for EURUSD I believe is to be 110-120 PIPs. Sorry, I could not give a significance to something that insignificant as Friday's "Markets Price expectation reverting back to the Fundamental of Time". I've started an explanation of the terms Fundamentals and Expectations here, since they are the key in this post (and many others), but decided to move it to my post, for one to keep this post simple (if that was possible at all You can find it Charting & Technical Analyst under My Elliot Waves Charts Best to all, ID Important NOTE: I'm not following Iris calls and I don't imply this to his calls, even that it just seem to me he was wrong on EURUSD for same time. I don't have a record of that and it is not the point here to prove that he is wrong. This is just my humble opinion and a different view on some of the Market essentials. |
Here is that part on The terms Fundamentals and Expectations:
I'm getting very annoyed with the implied meaning to the "Fundamentals" as being THE FUNDAMENTALS. Economic indicators are just a numeric representation (and not accurate but more of a trial representations) to RESULTS in the ECONOMY which it self is a one of the pillars of the society, since trough the "actions" of man in the "economy" he can fulfill one of it's FUNDAMENTAL NEEDS (the need for material necessities - food, cloths etc for himself and his family - or Economic security and safety). So the indicators are not FUNDAMENTALS.
As for the EXPECTATIONS, I've used them just because of the relation to the previous posts, and they are in fact (dreams, hopes, desires etc.)
One have NEEDS, then one Dreams, Hopes, Desire about fulfilling those NEEDS. These are the essence of the MOTIVATION. However the innate capacity to do or be (ABILITY) determines if the one will take some ACTION to fulfill his DREAMS, HOPES (explanation: while dreams are unlimited expectations full of "what ifs", Hopes require a "desired expectation" or the expectation that something will happen if nothing goes wrong) and DESIRES (explanation: the awareness that something better exists). It is the convergence/divergence of the DREAMS, HOPES, DESIRES vs ABILITY that creates HAPPINES or FRUSTRATIONS.
The simple fact is that all animals including humans, primal NEED is to SURVIVE, to continue to live. To do that they need to take actions. Trading Markets is one of the ACTIONS people trade to profit in money, to be able to fulfill their Dreams, Hopes, Desires - related to their NEEDS. It is how GREED could manifest it self in the trading. On the other side is the FEAR (of loss). It is a manifestation of the FEAR concerning ones Economic security and safety, connected with the PRIMAL INSTICT to SURVIVE (continue to live, preserve life) and it is why the FEAR is so sincere and strong emotion.
NOTE: I'm not a psychologist.
Last edited by idejan : 13-08-2005 at 21:09. Reason: Quotation inside quotation were not shown in my post.
My Elliott Wave Charts - Page 3 - MoneyTec Traders Community Forum
Wave Principle And Forces Behind The Markets
Hello everyone,
In my previous posts I have started writing on something I believe to be essential, and even that at this point it may seem confusing how it relates to Trading Markets, I'll hopefully come to that at the end.
I have previously talked about Needs, Dreams-Hopes-Desires (I'll use the word Expectations for simplicity from now on), Abilities, Actions and Results. And it seem like a one way road.
And to the some point it is.
But first let me try to recap and then continue.
All human have same fundamental NEEDS, but develop different Dreams, Hopes, Desires (Expectations) by the surge to satisfy their NEEDS. To satisfy those Needs man should obviously do something, ie - take Action(s). Expectations are the MOTIVATION (the fuel) necessary for one to take ACTIONS.
Now, For the purpose of performing Actions, we would need to develop or adopt a certain method, or general set of tools and guidelines suitable for that Action(s). Our innate potentials, to accomplish either what is physical or mental, those row latent capacities or abilities, talent, physical ability, intellectual and emotional aptitude, ie SKILLS, determine the APPROACH(es) we develop. On a higher level APPROACH determines if on is a BE-ER or a DO-ER or if his general approach to problem solving is to adopt him self to the situation or environment or to adopt the environment to himself.
And we now enter the real world and start to practice our Actions with our Ability using our Approach, driven by Expectations derived from our Needs.
So we act and interact with others (their actions) both mental and physical.
The cumulative effect of that action and interaction in observing and/or participating in mental and physical activities until they become familiar represents our EXPERIENCE. And that's how our Ability get's it's practical component. But just because those activities become a second nature, does not mean we are necessarily good at them. It is the innate Skills and the Experience together, that determine the our real ABILITIES. So every day aggregate activities (actions, interactions) are the building bricks of men's Experience determining that way his REAL ABILITIES.
So what that cumulative effect, ie Experience, really does is making us constantly evaluate and redevelop or adopt our Approach. The side effect of that process is that when ever we feel we are not able or feel being able for more, we also evaluate and redefine our Expectations. If we feel ABLE then our Expectations grow and opposite. If how ever our real Abilities luck of either Skills or Experience we could easily end frustrated, since our Ability could not fulfill our Expectations.
So driven by our expectations to satisfy our needs we develop Approach and start practicing our actions, by what we interact with other people (practicing their actions too), we build up an Experience, which then helped in determine our Real Abilities by adding a practical side to our innate Skills, and also made us constantly evaluate our Approach and Expectations.
To make it simple in a way if our Experience says we CAN and we than say GO, and if it says we can't we say STOP.
In that combined effort of our Skills and Experience in the pursuit of our expectations, as I've said before, we are not necessarily good at what we do. So we experience both Pleasure of success and Disappointment of failure on our pursuit of Happiness. It is how accumulated interactions, help developing ATTITUDE.
Attitude is the manner in which we proceed with our Approach. We may be hard driven, cool, assertive, but in general we could have a positive or negative attitude.
And here we are to the point were we can say that:
It is the Cumulative manor (Attitude) with which we all proceed with our developed and adopted methodology of doing and being (Approach) in our Constant pursuit of fulfilling our Expectations which derive from our Needs, that creates the Social Trends and Tendencies (General Sentiment).
That is the place where the Wave Principle comes in.
Since there are number of sources on the Wave Principle, I will not go into explaining what has already been explained by people with much more knowledge and understanding of the Wave Principle, but in some of my next posts, I will try to make some practical observation about trading it.
I've tried to give as possible simple explanation of very simple and intrinsic issues, but it seems that the most simple things take more time to explain, as for to me an unknown reason people do not accept simplicity. It seems to me that most probable reason for that however could prove to be the constant need of men to be Clever, and like simplicity insults cleverness. It is probably there where our constant need to complicate an obviously simple things derives. At least it's how it appears to be.
ID
Last edited by idejan : 14-08-2005 at 23:18. Reason: typo
My Elliott Wave Charts - Page 3 - MoneyTec Traders Community Forum
Forces Behind the Market
As I said I'll accept any invitation to exchange opinions in a discussion thread, and since daily recommendation threads are not a discussion I really feel uncomfortable discussing there.
So here is post as a continuation of previous and as an answer to Noor, who showed very constructive approach and with that I believe is a person who is willing to share his knowledge and experience.
(read his post @ Sell EUR/USD in Daily trade recommendation)
_______________
Hi Noor
My post is nothing more then a presentation of a different view on the forces behind the market, so I highly appreciate your constructive effort...
I'd like to add something to your explanation about divergence.
di•verge (also di-) -verged', -verg'ing, -vergence
- to go or move in different directions from a common point or from each other; branch off [paths
that diverge] (Webster)
But what's behind.
If you PUSH something it will always go in the direction opposite of the PUSH and as other forces
start to involve it will drift away of the path. The PUSH is divergent. On the other side, if you
PULL something (attach a string and pull) no matter how other forces influence the object in other
directions, it will always be going in your direction, more and more directly. So, PULL is
Convergent.
This are the two always co-existing fundamentals of the Universe (Push-Pull, Repulsion-Attraction).
The indicators that you've mentioned (for the simplicity, lets say) are trying to measure that.
(RSI and Stochastic (and Momentum) are Most known Oscillators and Moving Average Convergence
Divergence or MACD is a A trend-following momentum indicator and it could also be added to
oscillators group of indicators. This is a very simplified explanation and you should all find a
very good explanations on different market indicators at Investopedia).
As for the evidence on my view... But first congratulation to Iris on his work approaching 2000
posts. I was not aware that he has developed his own Price/Time theory. I admit I'm not very familiar with his work.
I've seen he is giving
signals in his thread and somehow assumed that that's it, that there is no explanation on how he
came up with those numbers. Never went through the posts from the beginning.
I don't know if you've read the addition published in my thread, since I believe it provides some
explanation on my view, and I'm not sure what will be a good evidence, to prove that view.
Personally I did not post anything here to prove something, but to present a different view. While
the concept of Driving a car is proven, different people will drive a car differently (producing
different results in a race for an example) and some will not even be able to drive. Even the
simplest task given to different people will create different results. It's why Forecasting Market
and Trading that Forecasts is very different thing, and above all different traders will have
different results with following same forecasts.
I don't however believe that anyone on this planet, no matter how genius, could possibly
comprehend all those incomprehensible number of inter-actions of continuous pulls and discontinues
pushes happening every single moment around the planet that influence every single aspect of our
life. It is why this is a game of Probabilities and not certainty.
All human have same fundamental NEEDS, but develop different Dreams, Hopes, Desires by the surge to
satisfy their NEEDS. Expectations are the MOTIVATION (the fuel) necessary for one to take ACTIONS,
and they all take different actions (since they all have different approach, or if they share the
same approach they all have different attitudes) to fulfill their Dreams, Hopes, Desires
(expectations).
It depends mostly on the fuel how far one will reach in fulfilling his expectations. ACTIONS then
produce RESULTS that are the reflection of those Expectations. It depends on the MOTIVATION and the
ABILITY how close to EXPECTATIONS are this reflections, or the RESULTS. It's something I always
argue with people, that it's not really important what you think and what you feel (relative to
others), since what you do, your actions are the real reflection of what you are. You will very
often be fooling your self how much you want something, but you should very easily measure "how
much" with looking at your actions, or what you do toward that wants.
It's now know that Activity and not Material particles are the basics of the Universe.
As for the view on the market and it's direction, I've covered that in detail in my posts so
there's no need to repeat my self here.
It is getting late, so hopefully we will be able to continue exchanging knowledge and experience in
our combined effort to take profit from the Market. I am very grateful to your constructive
approach, since I believe that there is always something new to learn. Helping others to learn,
helps you to learn even more.
Best to all,
ID
Last edited by idejan : 14-08-2005 at 02:58. Reason: typo
My Elliott Wave Charts - Page 4 - MoneyTec Traders Community Forum
Wave Principle
The reason People don't like Wave Principle is that it is not a mechanical trading system. The other reason is quite similar since it says that it is too subjective.
But then the majority of people who practice Wave Principle are trying to use it mechanically.
_______________________
And now for what I think is important about implementing Wave Principle.
In previous posts I've tried to point the fact that it is the Actions that move the world, but that it's our attitude (positive or negative) that greatly influences that actions and with so the results of that Activities.
It is the General Social Mood that determines the performances of the Society and it's Economy as a part.
The Wave Principle is exactly about that. Social, or Crowd behavior moves up and down (from positive to negative) in recognizable patterns. It is from this discovery that the market analysis method was developed now know as Elliott Wave Principle.
How good will someone use it, depends on learning the patterns of crowd behavior. By anticipating the crowd, he will be able to avoid becoming a part of it.
And while a careful reader reads: learning THE PATTERNS OF CROWD BEHAVIOR, most of the traders read: LEARN TO RECOGNIZE and LABEL WAVE PATTERNS.
Although it seems that those two are the same thing, it isn't. The difference is not in the method.
While the first will try to reveal the NATURE of the waves, and with that, the real forces behind the scene, the other, will try to recognize the geometry of the forming patterns and label them, obeying the rules and guidelines. That's a mechanical approach and has nothing to do with the Wave Principle.
It hasn't because of the simple fact that the human behavior, although moving in recognizable patterns which obey certain mathematical relations, which are represented by the correlations of PRICE (the indicator of the behavior) and TIME, is not a predetermined neither by Time or Price.
IT DOES NOT REPEAT and could change. It is called evolution. We all change, and we influence others to change, same as they influence us. Our mental, emotional and physical "support and resistance" lines change every single day (every second). We are dynamic system and an organic one, not a mechanical.
The wave Principle can prove good in determing the Most probable market direction and is briliant since you could also determine the CHANGE in the Behavior. It gives you a direction. Not a trading signals. Changes in behavior take time. People don't lose faith and positive attitude suddenly as they do not recover from pesimism by night. That's why it is very important to know how to recognize the nature of the patterns on your chart. And it is a different psychology on a different time frame. It's like wondering arround the streets and looking from the top of the hill.
_______________________
What wave Principle uses is the PRICE, where the PRICE it self is an INDICATOR of the agregate Social Behavior and MOOD. SO PRICE it self IS A MEASURE of SOMETHING and NOT a subject of measurement it self. (it could be but it's irrelevant to this) Wave Principle is about knowing the true Nature of the Waves, or what's beneath. The price is a matterial reflection of the Social Behavior, so what the geometry of price/time tries to reveal is not PRICE in TIME, but where the Social Behavior is and Where it is heading.
Would I be able to assess my possible future earnings (Price) by simply looking at my previous historical earnings, or by looking in my readiness, my mental, emotional and physical fitness to cope with LIFE, recognizing my true "expectations", using my real abilities and finding the best possible way fullfiling them (my behavior) all at right time?
_______________________
Let's imagine that we are about to go on a holliday. We live in a city "A" and we are to go to Place "B" by car.
We get a road map and the first thing we do is try to find where we are on the map and then where the place B is, we draw a straight line connecting this two points. Now by just a simple look on the map we instantly have a clear picture of where we are and where we would get eventualy. By observing the map more carfuly (Analysing) we start drawing the path we will go trough. While we easily drown a straith line connecting those two points on the map (chart) now we recognize that we will have to travel somewhat different path which will include a lot of straight lines (trends) and quite a few turns (corrections). We will most certainly need to get out to other main roads that somehow are not going in our direction (larger corrections/reversals) just to get to the point where we will get to our road which will lead as to the place B.
Well what we have here is an expectation (to have a vacation), which induced an action (we started preparation and hopefully got there) for which we developed a plan (approach) an adopted already proven plans (car transportation, road map for directions etc). So eventualy we pack our bags and start the journey. We have anticipated the path, approximate time of arrival based on speed etc, and some other important elements of the journey with our analysis, we printed a perfect plan and we now only have to drive from point A to point B to get there.
Let us now assume that the plan is so perfect that it includes all the possible turns, pointed within milimeter with GPS, an includes all the ralationships of speed and distances.
Now could you drive your car to the destination by simply looking at the speedometer following speed (price) and distance (time) and following that perfect map (on GPS)? Not even if the roads where empty. The weather, people in the car- your company, the car you drive, the man at the gas station and milion other things you could've never possibly dream and yet to anticipate. And even you. Your abilities (physical, mental etc.) are not a matematical constant that can easily be predicted and calculated. Or are you?
So even with having a clear recognized pattern of behavior and a perfect plan (we recognized we are heading from point A to point B and recognized the pattern which we will travel developed a perfect radmap) and with so many people already driven the same path over and over again, you could not drive eyes shot. There's always something that could change your plan. Something always does. Just hopefully you would arrive at your destination with godspeed.
Thank you for bearing with me all this way, and I apologize being so boring.
But only if humans were a rational beings.
Best to all,
Dejan
But then the majority of people who practice Wave Principle are trying to use it mechanically.
_______________________
And now for what I think is important about implementing Wave Principle.
In previous posts I've tried to point the fact that it is the Actions that move the world, but that it's our attitude (positive or negative) that greatly influences that actions and with so the results of that Activities.
It is the General Social Mood that determines the performances of the Society and it's Economy as a part.
The Wave Principle is exactly about that. Social, or Crowd behavior moves up and down (from positive to negative) in recognizable patterns. It is from this discovery that the market analysis method was developed now know as Elliott Wave Principle.
How good will someone use it, depends on learning the patterns of crowd behavior. By anticipating the crowd, he will be able to avoid becoming a part of it.
And while a careful reader reads: learning THE PATTERNS OF CROWD BEHAVIOR, most of the traders read: LEARN TO RECOGNIZE and LABEL WAVE PATTERNS.
Although it seems that those two are the same thing, it isn't. The difference is not in the method.
While the first will try to reveal the NATURE of the waves, and with that, the real forces behind the scene, the other, will try to recognize the geometry of the forming patterns and label them, obeying the rules and guidelines. That's a mechanical approach and has nothing to do with the Wave Principle.
It hasn't because of the simple fact that the human behavior, although moving in recognizable patterns which obey certain mathematical relations, which are represented by the correlations of PRICE (the indicator of the behavior) and TIME, is not a predetermined neither by Time or Price.
IT DOES NOT REPEAT and could change. It is called evolution. We all change, and we influence others to change, same as they influence us. Our mental, emotional and physical "support and resistance" lines change every single day (every second). We are dynamic system and an organic one, not a mechanical.
The wave Principle can prove good in determing the Most probable market direction and is briliant since you could also determine the CHANGE in the Behavior. It gives you a direction. Not a trading signals. Changes in behavior take time. People don't lose faith and positive attitude suddenly as they do not recover from pesimism by night. That's why it is very important to know how to recognize the nature of the patterns on your chart. And it is a different psychology on a different time frame. It's like wondering arround the streets and looking from the top of the hill.
_______________________
What wave Principle uses is the PRICE, where the PRICE it self is an INDICATOR of the agregate Social Behavior and MOOD. SO PRICE it self IS A MEASURE of SOMETHING and NOT a subject of measurement it self. (it could be but it's irrelevant to this) Wave Principle is about knowing the true Nature of the Waves, or what's beneath. The price is a matterial reflection of the Social Behavior, so what the geometry of price/time tries to reveal is not PRICE in TIME, but where the Social Behavior is and Where it is heading.
Would I be able to assess my possible future earnings (Price) by simply looking at my previous historical earnings, or by looking in my readiness, my mental, emotional and physical fitness to cope with LIFE, recognizing my true "expectations", using my real abilities and finding the best possible way fullfiling them (my behavior) all at right time?
_______________________
Let's imagine that we are about to go on a holliday. We live in a city "A" and we are to go to Place "B" by car.
We get a road map and the first thing we do is try to find where we are on the map and then where the place B is, we draw a straight line connecting this two points. Now by just a simple look on the map we instantly have a clear picture of where we are and where we would get eventualy. By observing the map more carfuly (Analysing) we start drawing the path we will go trough. While we easily drown a straith line connecting those two points on the map (chart) now we recognize that we will have to travel somewhat different path which will include a lot of straight lines (trends) and quite a few turns (corrections). We will most certainly need to get out to other main roads that somehow are not going in our direction (larger corrections/reversals) just to get to the point where we will get to our road which will lead as to the place B.
Well what we have here is an expectation (to have a vacation), which induced an action (we started preparation and hopefully got there) for which we developed a plan (approach) an adopted already proven plans (car transportation, road map for directions etc). So eventualy we pack our bags and start the journey. We have anticipated the path, approximate time of arrival based on speed etc, and some other important elements of the journey with our analysis, we printed a perfect plan and we now only have to drive from point A to point B to get there.
Let us now assume that the plan is so perfect that it includes all the possible turns, pointed within milimeter with GPS, an includes all the ralationships of speed and distances.
Now could you drive your car to the destination by simply looking at the speedometer following speed (price) and distance (time) and following that perfect map (on GPS)? Not even if the roads where empty. The weather, people in the car- your company, the car you drive, the man at the gas station and milion other things you could've never possibly dream and yet to anticipate. And even you. Your abilities (physical, mental etc.) are not a matematical constant that can easily be predicted and calculated. Or are you?
So even with having a clear recognized pattern of behavior and a perfect plan (we recognized we are heading from point A to point B and recognized the pattern which we will travel developed a perfect radmap) and with so many people already driven the same path over and over again, you could not drive eyes shot. There's always something that could change your plan. Something always does.
Thank you for bearing with me all this way, and I apologize being so boring.
But only if humans were a rational beings.
Best to all,
Dejan
Sunday, September 24, 2006
Market Update
Hi,
Here is just a small part of my notes I write for my own reference.
Pictures are bit compressed but they are clear and readable.
This are continuation of previous weeks notes from the Google group I've mentioned few post back, which will be available for a while before I delete them.
You will also find notes on 16 more pairs. I publish them by mail directly from the charting program and it's a life saving option.
This Blog somehow does not accept the same mails and it complicates the whole thing.
While I don't mind sharing my notes and thoughts, I'm still not very sure if it is useful to anybody.
Any way, until I find a solution that will save me time preparing and publishing my notes, I'll try keeping this blog live with at least few views published once a week over the weekend.
Thank you for your mails and interest in my analysis, and I hope to be able to spend more time answering all of your questions.
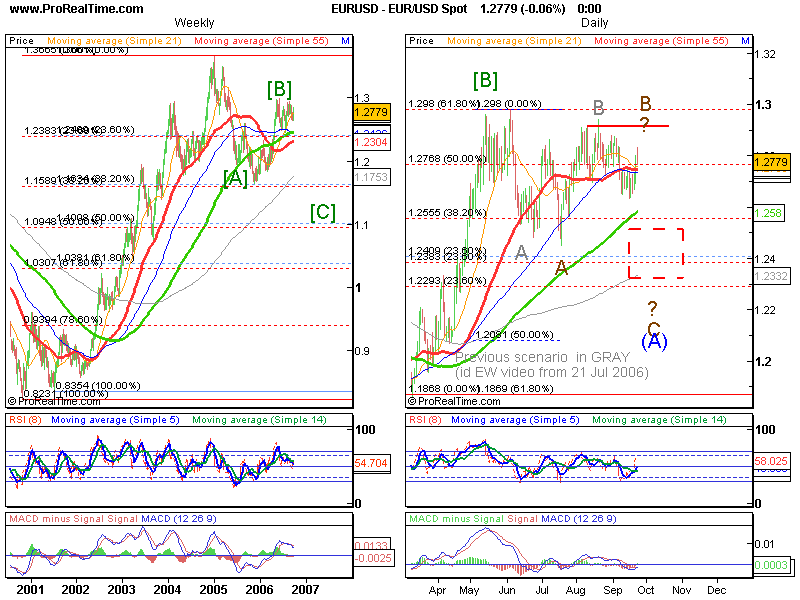
EURUSD
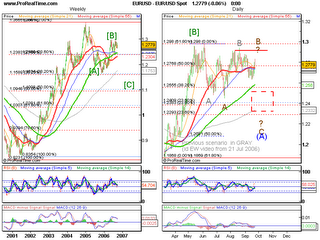
I mentioned last week that I don't quite like what I see on the chart, so I reconsidered my view.
I made a slightly different count from the one in the last video analysis I published, hm when was that, 21 July, quite some time. Any way here it how I see.
So, I have two possible target areas on the upside to finish that B on the Daily if not finished at Friday daily bar high. On a break of 1.2831 last Daily bar high, first up is 1.2872/77 and second is close to the previous top 1.2926/37/48.
Break down below 1.2725 to ease the upward pressure and below 1.2632 to confirm possible C of (A) down.
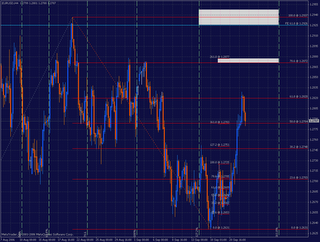
And here is the Hourly chart for more detail.
I personally think it is a top, but caution is needed.
idejan
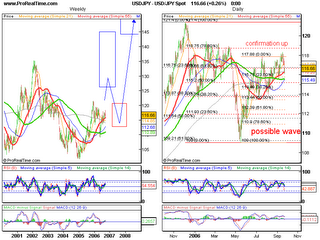
USDJPY
It is on target (see prev. post and for more targets too) but could end little lower, probably 115.84/53 to continue up...
idejan
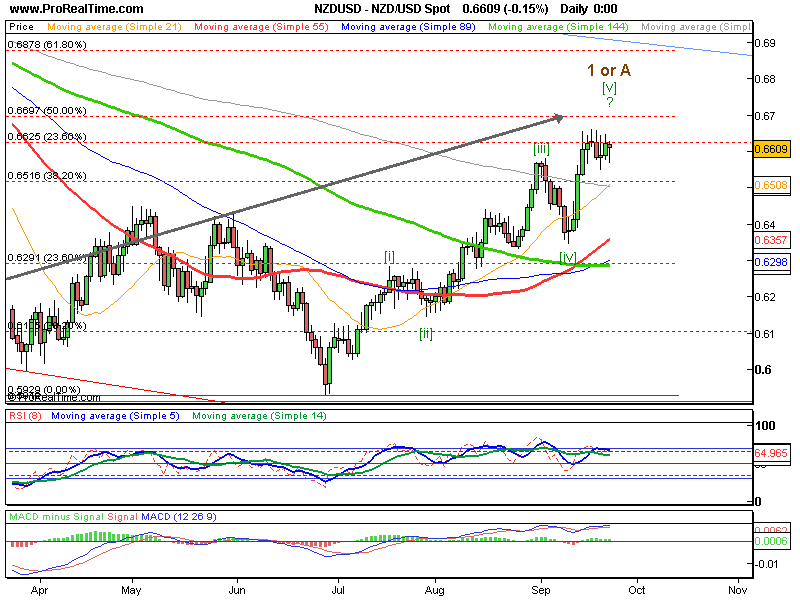
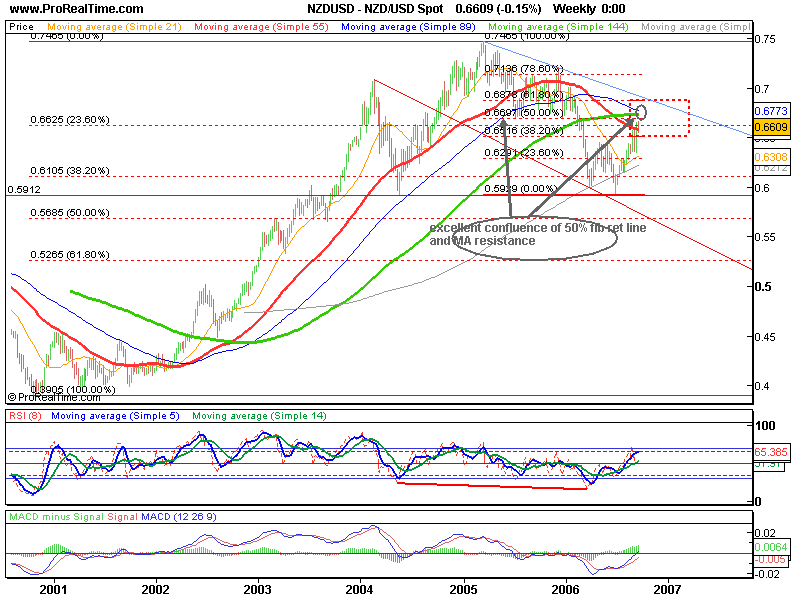
NZDUSD
Intraday probably lower to 0.654<>0.65
There are slightly different scenarios (EW counts) than the one on the chart in which we could have a Minute or Minor top.
If so than the correction could go lower than 0.65, to possibly 0.63.
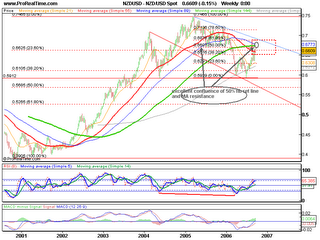
I still think it will finish little higher before it makes the second wave 2 or B. (see next chart weekly)
idejan
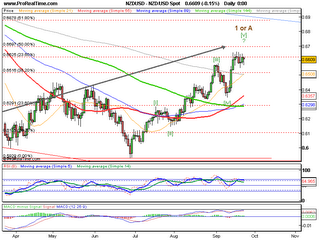
Here is the weekly chart and that nice confluence of Fib 50% Retracement line and MA resistance
AUDUSD
It made high 0.7580 and still above the green MA. (also see weekly)
(prev. bar on the weekly low @ 0.7483; red MA @ 0.7482 green @ 0.7490 and last bar low @ 0.7494, red @ 0.7479 green 0.7491).
This is the support needed to break to confirm down targets. First most probable target down is 0.7279/70 to continue down to 0.7 and below to 0.6792/81/72 targets...
idejan
Here is just a small part of my notes I write for my own reference.
Pictures are bit compressed but they are clear and readable.
This are continuation of previous weeks notes from the Google group I've mentioned few post back, which will be available for a while before I delete them.
You will also find notes on 16 more pairs. I publish them by mail directly from the charting program and it's a life saving option.
This Blog somehow does not accept the same mails and it complicates the whole thing.
While I don't mind sharing my notes and thoughts, I'm still not very sure if it is useful to anybody.
Any way, until I find a solution that will save me time preparing and publishing my notes, I'll try keeping this blog live with at least few views published once a week over the weekend.
Thank you for your mails and interest in my analysis, and I hope to be able to spend more time answering all of your questions.
EURUSD
I mentioned last week that I don't quite like what I see on the chart, so I reconsidered my view.
I made a slightly different count from the one in the last video analysis I published, hm when was that, 21 July, quite some time. Any way here it how I see.
So, I have two possible target areas on the upside to finish that B on the Daily if not finished at Friday daily bar high. On a break of 1.2831 last Daily bar high, first up is 1.2872/77 and second is close to the previous top 1.2926/37/48.
Break down below 1.2725 to ease the upward pressure and below 1.2632 to confirm possible C of (A) down.
And here is the Hourly chart for more detail.
I personally think it is a top, but caution is needed.
idejan

USDJPY
It is on target (see prev. post and for more targets too) but could end little lower, probably 115.84/53 to continue up...
idejan

NZDUSD
Intraday probably lower to 0.654<>0.65
There are slightly different scenarios (EW counts) than the one on the chart in which we could have a Minute or Minor top.
If so than the correction could go lower than 0.65, to possibly 0.63.
I still think it will finish little higher before it makes the second wave 2 or B. (see next chart weekly)
idejan
Here is the weekly chart and that nice confluence of Fib 50% Retracement line and MA resistance
AUDUSD
It made high 0.7580 and still above the green MA. (also see weekly)
(prev. bar on the weekly low @ 0.7483; red MA @ 0.7482 green @ 0.7490 and last bar low @ 0.7494, red @ 0.7479 green 0.7491).
This is the support needed to break to confirm down targets. First most probable target down is 0.7279/70 to continue down to 0.7 and below to 0.6792/81/72 targets...
idejan
Thursday, September 14, 2006
My On line Notes
Hello all,
it's been a while since my last post.
I got an answer from google team that I won't be able to have my Analysis organized in topics at my Google group if I publish them by sending them by mail, as I do now directly from the charting program (nice feature in ProRealTime charts).
Since I don't have time preparing first and then posting them later with a reply (which is the only way they can be organized in topics), I decided to delete the group I've been using as my on line notebook. No use of it if it's not organized and easy to followup.
I downloaded all my notes, so now I'm making it available to you before I delete it. If it can be of any use to you at all. Not really educational and calls are mostly expired or about to expire...
http://groups.google.com/group/waveid
idejan
Subscribe to:
Posts (Atom)