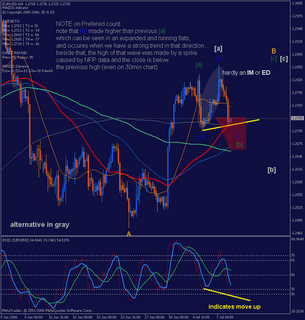
 On the chart is the update of the previously published chart.
It shows a possible Running Flat (wave [b]), and if the recent fall wave (c) continues lower of (a) it will be an Extended Flat. Of course break below 1.2478 will confirm C down... On the other side, break above 1.2980 will invalidate this scenario.
Best to all
ID
No comments:
Post a Comment