Friday, March 10, 2006

Tennis Anyone?


Idejan,

Thank you for the video, very nice!! I guess months from now we all will be sitting back, studying them charts and saying ”That’s what was going on”. Until then the hunt continues.

Late last year I was convinced that we were ending a 5th and headed north for a correction, and although price has headed north from the first of the year it has done so with reluctance. And while it has been hard for me to number some of the smaller degree 5 waves in some of the earlier price action, either motive or larger corrective zigzag, I’m now starting to think there’s more south to come.

Price has held again today on yet another sliding parallel from the prior daily fork, as long as this holds it’s making me think that more range trading is to come. Now wondering if we are in the final wave of an ABC correction from the end of last year.

Thinking that this is like a failed C” wave triangle or perhaps a flag?( A bear's thoughs). If this view is correct we could have another test of the top the “c” followed by a test of the low “d” and then a brief run to “e” and then the bottom would fall out.

Just trying to stay a step or two ahead…..

Well for some reason I can’t add a picture again will edit when able…………problems solved

USDJPY: The fundamental aspect.

Its Price, Price, Price, but the Interest Rate scenario is tied very closely to investors' purse strings -- that's the reason I pay attention to monetary policy in Japan.

Another compelling reason is that the Yen dances to nobody's tune. It is one heck of a loner; ninjas, yakuzas, Mafia, gurus and everybody worth anything has tried to come up with some sort of correlation that would provide clues to how the Yen works. So far, zilch; a dead end.

With the dollar, you could look into bond yields, Libor differentials, Forward Rates, Fed funds Rate etc., to get some idea of what is going on. With CAD you look at the Toronto Stock Exchange for clues along with fund inflows and the CRB component of the Stock Exchange etc.--

But with the Yen, there's not a single thing that comes even close to giving a halfways decent clue.

What all players want to know now is this:

"Will the end of Quantitative Easing be followed quickly by the ending of the zero interest rate policy?

That's the ticket, guys.

Japan has flooded the universe with liquidity, & has been a main source of capital and savings for the world. Now that looks like it is going to change.

I have an answer to the dilemma and therfore one more key point in my ongoing decision whether to buy (long) USDJPY or not!

The Quantitative Easing policy did not begin in earnest until 2003, four years after interest rates were reduced to below 10bp in 1999 and two years after they fell to absolute zero in mid-2001. Thus a gradual reduction in bank reserves from the present ¥35 trillion to ¥15 trillion (where they were in 2001) or even ¥5 trillion where they were in 1999 would be perfectly compatible with zero or near-zero interest rates.

It is highly likely that BOJ will reduce liquidity while maintaining a zero Interest Rate policy for this decade.

There is a good reason for sticking with the zero interest rate policy.

Japan has a huge government deficit and a very high level of public debt relative to GDP. Thus when the economy gets strong enough to withstand a deflationary impact, the Japanese will want to hit it with fiscal rather than monetary tightening. Tax increases are already in preparation for 2007 or 2008 and to make sure that they can be implemented without causing a 1997-style economic disaster, Bank of Japan and Ministry of Finance officials have agreed that monetary policy should remain ultra-loose for the foreseeable future.

All the discussion about ending Quantitative Easing seems to have persuaded many investors that the zero rate policy is also about to be abandoned. The Japanese yield curve is now discounting a very aggressive increase in interest rates, with short rates expected to rise by 75 bps this year and 150 bps by the end of 2007.

I am stating that Interest Rates will remain under 50 basis points or so for the next few years.

I'm satisfied with my fundamental analysis of the situation and furthermore, one more point in its favor is that now the herd is going strongly towards rising Japan Interest Rates. I certainly don't want to go with them. The opposite is the more likely scenario, namely, rates will stay close to zero!

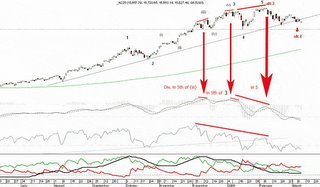
Divergence study is now complete! Thanks.

Wow! You took it even one step further than I was envisioning -- I had not even considered a divergence between 5th of (iii) and 5th of 3.

Man, I tell you, this is one heck of a top-notch class I'm fortunate to be in.

Its the basics that are popping out at me and all my failed purposes with EW are getting rekindled.

I believe that in a year or so, I'll be a force to reckon with.

Thanks buddy.

NEW EURUSD video analysis

I posted a new Video Analysis on EURUSD and you can find it by clicking on the link in the right sidebar.

While I was prepearing the files for publishing, uploading the files to the pages price made a strong spikes down, stil it can't be taken as a confirmation. I'd prefer this to clear up before it can be clear if we have a confirmation down or we can expect this to be still part of the correction.

RSS Feed link
For those that use RSS readers and would like to receive this blog via RSS, use this link to add this Blog into your feeds.
http://waveid.blogspot.com/atom.xml

ID

Joseph: divergences in 3rds


This chart was prepared for that previous post, and I was confused when I saw your post today, since I was not aware I've missed posting it.
So here it is, and as you can see I agree with your observation about the divergences in 3rd waves, actualy as I wrote in previos post in my observation, 3 wave cycles are not producing divergence and any 5 wave cycle (which means not only IM) are giving divergence.

Divergences in the substructures are reflected too depending od the degree and the time frame you are observing.
I haven't done a study on this, but when I've mentioned observing patterns on RSI I was reffering to this.
I dont have MACD on my charts so I can't speak much about it but it is clear to me that you can't play divergences on their own, but reather use them for inforcement on price patterns.

Now Joseph, I became aware that there are questions I've missed answering, so if it's not too much of a trouble to you, could you please mail me all of the questions by mail so I can have them addressed one by one.
Dejan

Myth busting # 3 (contd) Fed funds Rate

How did the moron try to kill a bird?

He threw it off a mountain cliff !

-----------


See my earlier post on Fed funds Rate going way, way up into the clouds.

And what were the geniassssses saying then? 4.5, perhaps 4.75 tops and then we go down, down, down!

What are they saying now?

"Over the course of the current tightening cycle, many market participants have been repeatedly surprised by the magnitude and duration of the Federal Reserve’s action. Several times the market has gotten it into its collective head the Fed was done — including in the immediate aftermath of Hurricane Katrina, or the “one-and-done in 2006” sentiment — only to reverse itself later. Analysts are now forecasting additional hikes to the 5.00-5.50 percent range before this cycle is over."

Why can't a moron dial 911?

They can't find the 11 on the phone!


Myth busting # 4: Trade Deficit & USD


If you mow your lawn and find a car, you're a redneck.

But a Moron? .... that's a whole different ballgame .....

Why did it take the moron an hour to eat breakfast?

Because the orange juice carton said, "Concentrate!"

How many times have I heard the dollar's problems blamed on the Trade Deficit? Hundreds of times ... and by every single major News org and TV station to boot.

Recent examples: (plucked from EWI site; I have my own charts on this subject but their's are superior, so I present it here instead of my own)


“The US trade data for January is due on Thursday and may trigger some selling if it draws attention to the structural problems facing the US economy.” (AP)

“With expectations for a wider-than-expected result in the US trade gap, there is enough scope for disappointment, making the dollar vulnerable.” (Forbes)

“The widening of the US trade deficit was a key factor behind the dollar’s three-year decline through the end of 2004 and currency analysts warn it may send the US currency falling again.” (Reuters)

EW lesson 1 ... (contd) .. divergences before wave 5!!!

I know quite well about divergence showing up in wave 5. I am talking about subtle divergence showing up BEFORE wave 5 -- actually at the very end of the 3rd of 3rd.

There is NO Elliott rule on this, I am sure, but I was asking if you personally had observed any such occurrence?

I have, actually -- in spades, and would very much like you to give it some thought over the next several weeks, if you haven't already.

Here's the gist of it: (refer to uptrend as an example)

The 3rd of wave 3 produces maximum impetus which is clearly visible on Macd histogram, Macd and RSI(14). Then, when the actual wave 3 completes, generally there is a clear negative divergence already showing on these 3 indicators. So, actually this is the start of the divergence -- it actually starts right after 3rd of 3.

Then wave 4 generates a lower low usually and shows larger displacements on the histogram, Macd and even RSI generally.

From this huge drop in momentum, it is easy to see why wave 5 delivers the final divergence. There is just too much ground lost for it to make up, especially considering the fact that it is a terminating wave.

My point is that we've got to look earlier than wave 5 for the point when such divergence is actually being born!

EW lesson 1 continued .... answers requested.

Please see the same chart of Nikkei daily from March 2003 bottom.

(1) Yes ID, the black count is same as your count. OK, no problem here.

(2) Here's what I meant by the drop -- refer to the drop from the Feb 2006 highs. Keeping the degree of tend the same, i.e. Minor waves as shown, I was not sure where wave 3 ended -- January top or is it the February top. Sorry about the error in communication.

So, to repeat; could the Feb top be the top for wave 3 instead of the January top? This would mean that we are now in wave 4 down, with wave 5 yet to come.

Please clear this for me.

Thanks amigo.

EURUSD: wave 1 or A -- my answer to Bear's question.

This was my thought process -- humbly submitted. Don't know how many EW rules I'm breaking here, but ID can set me straight on this score.

Joseph's EW#1: Within the structure of the supposed wave 1, if there is no clearly discernible (ii) and wave (iv) looks like a picnic, plus the lack of any wave iv within (v) of 1, I smell a rat and this noxious smell usually is the malodorous, soon to be coming to life, wave B, farting in advance of initiation.

Joseph's EW#2: Look back to the corrective drop in early 2004 within the previous bullrun -- if the 2005 drop is wave 1, it is as dubious as a one-legged man in a butt-kicking contest! ..... especially considering the long 4-year bullmarket, one would expect a true wave 1 to kick better ass.

Joseph's EW#3: First waves aborn out of BASING structures and sometimes even in these bases they are hard to distinguish because they never rise out of the base and get hammered by wave 2 within the base itself. This type of wave 1, I call a faggot because wave 3 then has to do all the work while wave 2 thoroughly buggers wave 1.

The other type of wave 1, also out of a basing pattern, is a sight to behold -- this is a different animal altogether. Even on the chart this type of wave 1 looks exactly like an underpantless gigolo who's just seen a beautiful, sexy woman with lots of money.

There was no basing pattern in 2004, therefore this is one more point I used in the elimination process. Odds here heavily favored a wave A in my book.

Joseph EW 4: Wave 1 has a definite tendency to whack the uptrendline; at least put a dent in the sucker. If this was a wave 1, he kissed it, fondled it, got his sacs emptied and then rebounded -- here then is another reason why we are dealing with an A, because wave B of A is next -- the perfect setup for Euro bulls to buy the dip and go Long ..... to eternity, hehehe.

I speak only for myself -- and keep in mind that I've been sent here to blow my account to smithereens & to ensure that the Scriptures are fulfilled! :) :)

On a more serious note:

actual confirmation that we are not dealing with an OVERALL impulse wave for the entire 14 month run starting from December 31, 2004 is further confirmed only in hindsight by the following points:

(1) If the first drop was a wave 1, then the subsequent wave 3 into July 7th, 2005 was a mellifluous pussy. Why? Because even Jack was still bullish the Euro. No recognition in the 3rd of 3rd that "hey, this is dangerous, something weird is occurring" -- I'm going to get buggered if I don't reverse and jump on the train. I'm going to be left behind." None of this type of thoughting, thunking or whatever.

And what's been happening for the last several months, since the July bottom, is the characteristic limp dick wave B, fooling everybody with divergence galore, making all kinds of noise to mask the truth that he can't get it up. The reward at the end of this charade? Full retracement by big dick wave C to under 1.0000!

Adios!