This is a recycled text from my MoneyTec Elliott Wave thread about fundamentals, and was a part of the answer to a distinguished member of MTec community. It is a good illustration about the correlations in mood and "fundamentals".
...If however we were in a bar, and you'd ask me which one of the two girls sitting at the other side of the bar I'd prefer, the blond or the brunette, (I'd most probably said both, but) let say I'd said I prefer the blond.
On the other hand if I was to give you a rational answer, I'd probably said that I'd consider face, body, length of their legs... and other attributes (or, their "fundamentals").
However both you and me, we know that it is the amount of beer we've drunk that's the most important factor in the decision making process (or the mood).
Oops, I did not mentioned some fundamentals like intelligence... it's definitely the beer.
ID
but then again it's only me being impressed with social phenomenas...
and only if people were rational beings...
Tuesday, February 21, 2006
Monday, February 20, 2006
Correlations, "Fundamentals" and Elliott Wave
Thank you Joseph,
My favorite show Myth busting got us closer to the point why Elliott Wave principle could be considered a very reliable tool if used properly.
At different times and circumstances people react differently to "fundamentals", depending on their "mood" (illustration to follow). Because of that, you will find that correlations tend to diverge/converge from period to period.
I have mentioned in few occasions that I tend not using Wave Principle mechanically, meaning that I don't observe just a geometry, but I try to comprehend whats behind.
I am aware that for many it is almost stupid thing to even think off and even more to try doing it. Even I would agree, but it is not quite impossible, or at least it is not impossible to get closer to the real picture behind scene.
It requires collecting all the pieces of the puzzle, and trying to fit them all to get the best picture on whats behind the scene.
So beside the EW outlook, Fibonacci lines, S/R and RSI, it requires following news and economic calendar, considering different correlations, comparing different scenarios, and as I said, trying to figure it out how they all fit into the puzzle.
My best analysis came when I was really "into the zone". And I can tell you that at times, I was spending on average 30 minutes on each currency pairs.
And in it is not important what you think about the fundamentals, but you must try to figure out, what will Market take into consideration and how it will consider that information.
"Fundamentals" have a very limited influence on the price action, so it is wise to avoid trading the news (announcements of ec. ind.), and you will always get a good indication for your EW view when the dust comes down after the news.
In a moments of inspiration in my first thread on MTec, I have tried to explain what in my opinion are the real fundamentals behind the price action. I could summarize that and post here for those that did not had an opportunity to read it in some of my nest updates. Not a very entertaining reading as Joseph's myth busting episodes :)
USDX
check previous post, this is follow up:
Down to 90.15<>90 intraday
Looks like we have at least a minute top, and we can expect DX to go to 88.74 and most probably below that and below the low of 87.83 down to 86.30/20
Failure to break below 89.70<>89.60 could be a good indication of a possible continuation up above 92.63 top.
in pairs
first my favorite for some time now
JPY
previous post still valid
stayed below 119.37 and now it looks like we are in a downtrend to mentioned targets to min 115.3 but more probably 113<>107 (111.6<>110.7)
Intraday, below 117.85 is good for min 117.20/10
EUR
from previous update:
"Intraday, we could see this drop finishing little lower, just below 1.18<>1.17 in EUR, after it corrects to 1.1940/46. "
passed 1.1940/46 so the new update on EURUSD is:
Intraday down to 1.1915 but not lower than 1.1905 to continue up to 1.2045/55
Above that could mean min. 1.2200/40
I believe that we are in a continuation down to min 1.15/14 and I expect that this ongoing correctional action will finish at 1.2045/55 or below, but not higher than 1.2321 high. After that I expect a drop to 1.15/14 price levels.
from previous update:
"GBP could stay above recent low in GBP and correct to around 1.74<>1.76 (7433 and 7545) before it continues down to mentioned prices."
confirmed for now and still valid.
from previous update:
"CAD - Not very clear, but up to 1.167 and possibly up to 1.2 longer term down to below 1.00"
failed, so it could mean continuation down. If so Intraday should be limited below 1.1525 to continue down to below 1.12
from previous update:
"NZD possible small correction to .671<>.675 then down to .664<>.66"
fell directly to target zone after the post, low at .6621
Most probable next move up to .6790 to .685
Both CrudeOil and Gold still in correctional move down, but at the moment thay are in a smaller sub wave up of that correction and they both have some more on the upside before they continue down.
ID
My favorite show Myth busting got us closer to the point why Elliott Wave principle could be considered a very reliable tool if used properly.
At different times and circumstances people react differently to "fundamentals", depending on their "mood" (illustration to follow). Because of that, you will find that correlations tend to diverge/converge from period to period.
I have mentioned in few occasions that I tend not using Wave Principle mechanically, meaning that I don't observe just a geometry, but I try to comprehend whats behind.
I am aware that for many it is almost stupid thing to even think off and even more to try doing it. Even I would agree, but it is not quite impossible, or at least it is not impossible to get closer to the real picture behind scene.
It requires collecting all the pieces of the puzzle, and trying to fit them all to get the best picture on whats behind the scene.
So beside the EW outlook, Fibonacci lines, S/R and RSI, it requires following news and economic calendar, considering different correlations, comparing different scenarios, and as I said, trying to figure it out how they all fit into the puzzle.
My best analysis came when I was really "into the zone". And I can tell you that at times, I was spending on average 30 minutes on each currency pairs.
- I start my weekly analysis with checking longer term view I have on a weekly chart, to see if the action so far fits into the preferred longer term view(s)
- Then I check the Primary and Intermediate outlook on a Daily
- continue analyzing the unfinished intermediate pattern from the Daily chart on the Hourly chart
- down to unfinished Minor pattern (and to Minute patterns if I look for intraday)
- At all this stages I also look/check on important fib lines, S/R and RSI to get more confluence with my EW view
this is the part of my standard Technical Analysis.
But, to get really close to whats behind the scene, you must follow news and economic indicators, and try to comprehend how they fit into the charts and your view.And in it is not important what you think about the fundamentals, but you must try to figure out, what will Market take into consideration and how it will consider that information.
"Fundamentals" have a very limited influence on the price action, so it is wise to avoid trading the news (announcements of ec. ind.), and you will always get a good indication for your EW view when the dust comes down after the news.
In a moments of inspiration in my first thread on MTec, I have tried to explain what in my opinion are the real fundamentals behind the price action. I could summarize that and post here for those that did not had an opportunity to read it in some of my nest updates. Not a very entertaining reading as Joseph's myth busting episodes :)
USDX
check previous post, this is follow up:
Down to 90.15<>90 intraday
Looks like we have at least a minute top, and we can expect DX to go to 88.74 and most probably below that and below the low of 87.83 down to 86.30/20
Failure to break below 89.70<>89.60 could be a good indication of a possible continuation up above 92.63 top.
in pairs
first my favorite for some time now
JPY
previous post still valid
stayed below 119.37 and now it looks like we are in a downtrend to mentioned targets to min 115.3 but more probably 113<>107 (111.6<>110.7)
Intraday, below 117.85 is good for min 117.20/10
EUR
from previous update:
"Intraday, we could see this drop finishing little lower, just below 1.18<>1.17 in EUR, after it corrects to 1.1940/46. "
passed 1.1940/46 so the new update on EURUSD is:
Intraday down to 1.1915 but not lower than 1.1905 to continue up to 1.2045/55
Above that could mean min. 1.2200/40
I believe that we are in a continuation down to min 1.15/14 and I expect that this ongoing correctional action will finish at 1.2045/55 or below, but not higher than 1.2321 high. After that I expect a drop to 1.15/14 price levels.
from previous update:
"GBP could stay above recent low in GBP and correct to around 1.74<>1.76 (7433 and 7545) before it continues down to mentioned prices."
confirmed for now and still valid.
from previous update:
"CAD - Not very clear, but up to 1.167 and possibly up to 1.2 longer term down to below 1.00"
failed, so it could mean continuation down. If so Intraday should be limited below 1.1525 to continue down to below 1.12
from previous update:
"NZD possible small correction to .671<>.675 then down to .664<>.66"
fell directly to target zone after the post, low at .6621
Most probable next move up to .6790 to .685
Both CrudeOil and Gold still in correctional move down, but at the moment thay are in a smaller sub wave up of that correction and they both have some more on the upside before they continue down.
ID
Excellent primer
Excellent primer, thanks Bear & Joseph
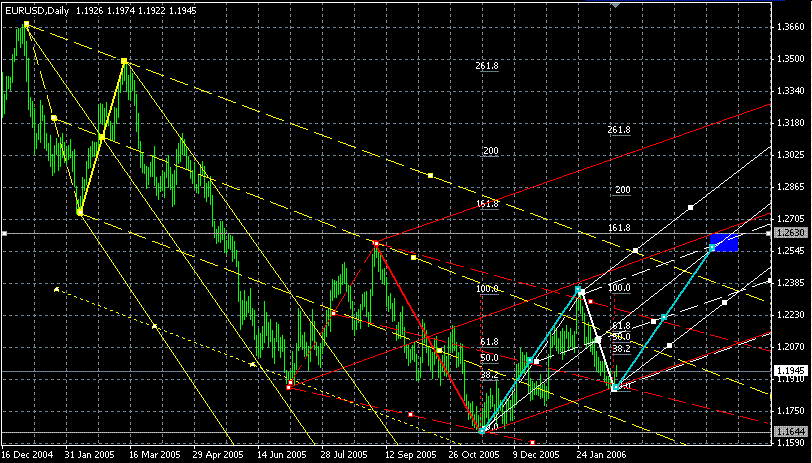
Being a keen student, I have drawn some pitchforks on the EURUSD chart. Looking at targets for the c wave, 161% of wave a, a=c & two pitchforks all give a target around 1.2560-1.2630. (I'll attach a chart if I can find out how.....)
Bear, I notice that you have two target areas on an earlier chart, I think one of them matches the one I have come up with. How did you identify the other target?
Thanks
Charlie
Myth busting #2: CAD is a commodity currency!

It is downright dangerous to rely hugely on intermarket relationships -- why? .. for they can change on a whim and leave you high and dry.
If you insist on a correlation then a more appropriate one for CAD is the 2-yr Canadian bond and then the Toronto stock Index.
See CAD and Oil chart with long history. Crude Oil in lower window has not been updated to 2006, but you know that it topped out at $70.85.
What's gotten the Media into this commodity currency misnomer is the fact that CAD and Crude have gone together since 2001.
But what about before that?
Crude's been in an uptrend for at least 65 years whereas CAD has been in a downtrend for 30 of those years.
How can a downtrend and an uptrend be positively correlated?
Furthermore observe that from Jan '99 -- Nov '00 Crude shot up almost vertically; a giant move it was -- and what did CAD do? She just responded with a feeble move to the upside that didn't even go the extent of Crude's move.
Tha above is my work, but look for confirmation of this in the February 2006 CurrencyTrader Magazine article on CAD.
excerpt:
Canada is an important exporter of commodities such as crude oil, natural
gas, nickel, copper, and lumber, but none of these correlations are anywhere
near as high as for two-year notes or the SP-TSX index. It would be
just as fair given this data to call the CAD a “note currency” or a stockcurrency as it would be to label it a “commodity currency.”
There is however a sidedoor relationship with the CRB index.
The next dopey fundo analyst deserves a swift kick in the 2-moon junction.
For likeminded Pitchfork students .... enjoy! :)
Firstly, let's not forget who's responsible for opening these particular floodgates and unleashing a torrent of rocketfuel to my technical engine -- that poy-son be Bear.
My study is concluded. Now on to application.
Here then, after scouring the Web and Bear's preferred site for relevant data pertaining to Pitchfork power, I've narrowed the fuel down to just one article, which I believe packs a solid punch for other newbies (like myself).
One could always go to to read Tim Morge's book if one so desires, but I believe the article I'm offering here is more than adequate for immediate sorties and getting one's feet wet.
Go to the following link and study the article.
http://www.investopedia.com/printable.asp?a=/articles/forex/05/AndrewsPitchfork.asp
For Bear: Pitchfork timeframe usage success?
In your own personal charting experience, which timeframe have you been most successful with w.r.t. Pitchfork usage?
Thank you
Joseph
Thank you
Joseph
If you don't risk anything, you risk even more!
God help us! This cave dweller not only knows how to eat honey; he's versatile with trendlines too. :)
Thanks Bear! I'm spending time today at Medianline for additional nuggets, if any. There is considerable promise in this tool, especially the Schiff variation, which, at first encounter, appears to suit my personality natively.
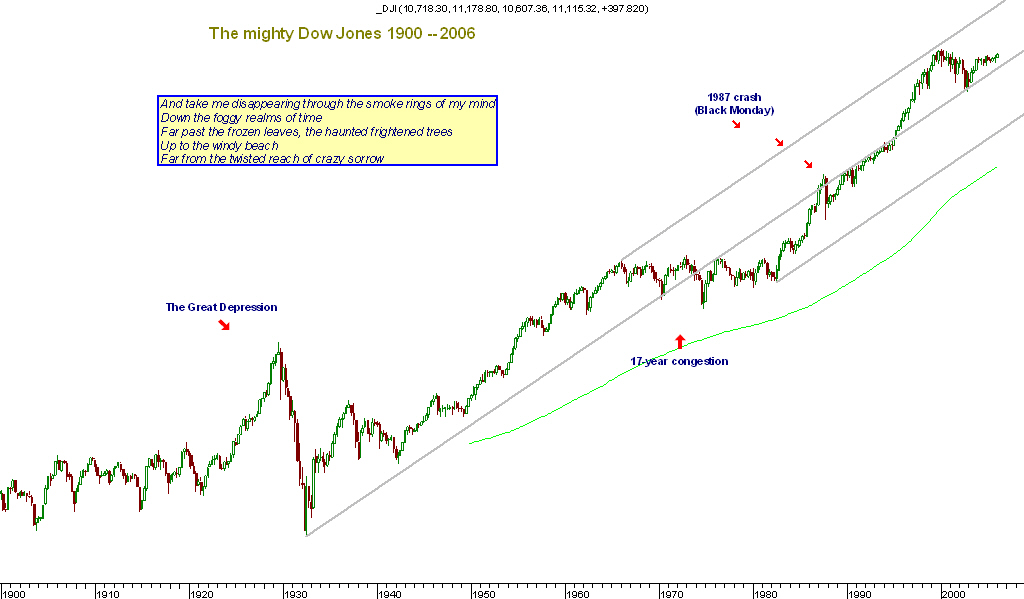
And, for vistors, do not miss checking out Idejan's Dollar Index daily chart (a few posts back).
Why? Because its a work of art, that's why -- of the same order of magnitude as Maradona's soccer goal past Peter Shulton in Argentina vs England aeons ago.
Furthermore, for even more shockers, go back to the Moneytec thread of the same name as this blog's header and revel in the numerous correct calls made by this gifted elliottician.
Its not going to be too much longer before the fatcats discover him and entice him stateside with million-dollar salary offers -- then its going to cost us USD 100/chart, hehehe -- get 'em now while he is still a pre-star!
Thanks Bear! I'm spending time today at Medianline for additional nuggets, if any. There is considerable promise in this tool, especially the Schiff variation, which, at first encounter, appears to suit my personality natively.
And, for vistors, do not miss checking out Idejan's Dollar Index daily chart (a few posts back).
Why? Because its a work of art, that's why -- of the same order of magnitude as Maradona's soccer goal past Peter Shulton in Argentina vs England aeons ago.
Furthermore, for even more shockers, go back to the Moneytec thread of the same name as this blog's header and revel in the numerous correct calls made by this gifted elliottician.
Its not going to be too much longer before the fatcats discover him and entice him stateside with million-dollar salary offers -- then its going to cost us USD 100/chart, hehehe -- get 'em now while he is still a pre-star!
Sunday, February 19, 2006
A Pitchfork Primer, finished

Next variation on the pitchfork is the Schiff;
B and C points remain the same but the A point or handle is moved to the midpoint of the A to B line.
You will have to experiment with this to understand it’s beauty, this variation of the pitchfork defines price repeatedly in the forex markets. I often draw the shiff at the same time I draw the normal fork, for price will generally respect these lines.
The other variation not shown would be a discretionary fork, basically your adjusting the “A” point in any position so that the median and parallels define price, more of an equidistant channel.
The nuances of the pitchfork are too many to list one just needs to study to see what fits with the individual , but imho it well worth the effort.
Bear
A Pitchfork Primer, cont’d.

Here’s my feeble attempt at pitchfork explanations.
Imo, there are basically 3 different variations of pitchforks, the differences are in the positioning of the “A” point or handle. The Three are Traditional, Schiff and what I call Discretionary.
The Traditional pitchfork drawn from 3 consecutive swing points basically gives us an angle for future price movement, like drawing a channel in advance. The upper, lower and median lines are like targets for price. Price will normally reverse or stall at these levels, once a reversal takes place price will normally travel to the next line. If price penetrates a line it will normally retest that line before going on.
Other lines that come into play are the; See Chart
Action/target lines, these would be trend lines that are drawn from the A point out thru the B and C points
Warning lines (parallel lines) that are spaced equidistant out from the fork
The normal use of pitchforks is to draw it from the three points and the median would be the logical target. A lot of traders like to see the parallel line that is drawn from the 3rd or final "C" point retested to confirm that price is respecting the fork before entering. Like price making an EW 1 and 2 points back at the parallel before heading on to 3.
One thing I do take notice, I like to see price make the median in the same length of time as measured from the A point to the cross bar or center point of the B to C line. This is shown on the chart as the orange shaded area and then duplicated in the pink. This is just my take, but if price fails it’s attempt to reach the median in this time, it normally means that price is headed back towards the level of C or the Action/reaction line
One other thing is support/resistance lines drawn parallel with the fork thru price often come into play, often times you will see the angle or slope of the fork resonate or duplicate itself throughout the wave.
One more chart coming…..
Subscribe to:
Posts (Atom)