Saturday, February 25, 2006

Bear brained entries


If I had to pick a level to stage longs on the Yen (this assuming the current high holds) would be from here and I would increase the size of my entries as price dropped

ID: Excuse my manners -- thanks for work on Nikkei!

:) :)

ID: Consider the revised EW count ..... and why!


ID:

Nikkei is not in a bullmarket whatsoever -- the BEAR is alive and well, albeit in hibernation!

After the breakdown from the Primary wave B (B O) triangle in 1997 the entire move thereafter is Primary wave C (C O).

Allow me to explain and I apologize for my brashness & intransigence as a student. :) :)

Nikkei cannot be in a 5-waver for the simple reason that the entire run from March 2003 has to be labeled as an ABC due to the previously missed, yet unmistakeable converging triange at the end of the first stage of the rally from March 2003 -- see my weekly re-counted wave labels.

The triangle is almost perfect and since it cannot occur in a wave 2 position, that first leg of the rally from March 2003 MUST therefore be wave A.

Then, to continue, please observe how beautifully wave B can be drawn.

Then, finally notice how, after price broke-out of the wave B triangle and moved into wave C, the character inherent in wave C caused a sheer vertical climb, the awesome power relinquished also happened to coincide with the previous 2004 top being taken out.

All in all, I've had to revise my entire count by calling the entire runup from March 2003 an Intermediate Wave (2). Wave (3) down comes next and I therefore state that the BEAR market of the Nikkei is going to once again shock all Media as it is set to continue.

My gut instinct had always been that the so-called bullrun the Media was claiming from the 2003 bottom was corrective in nature, but I just could not prove it. Maybe my eyesight has changed or perhaps the Ego was napping and a vital message came thru', hehehehe ....

Oh, also note how nicely the 78.6% level of the entire 1900-1989 run halted Nikkei's drop, but it was whacked pretty good.

Eliminating risk

Joseph & Idejan,

If I can chime in with a couple of thoughts:

Please understand that the Bear is still very much an amateur trader with a long way to go, but the following is the mindset that has been molded by a couple of a very generous gentlemen guru traders to which I am forever thankful.

In a nut shell when we trade, the best case scenario we can hope for is informed speculation.

Now what makes this different from gambling (where the odds are fixed), we can choose the place, time, method and amount of our wager, if this term applies.

We apply our craft to the charts and choose a game plan that we see offers us the best opportunity for profit. The two sides of the equation we need to measure are potential profit and assumed risk.

All that being said, gets me to the issue of my thoughts. Eliminating assumed risk and the free ride.

Please keep in mind that this is the way I think, everyone’s own trading style is unique to them and fits to their own personality, that’s why it so hard to make trade calls, imo. It’s tough to make a call for a multitude of different traders with different risk and reward tolerances.
You asked me the other day why I felt that it was not the time to go long:


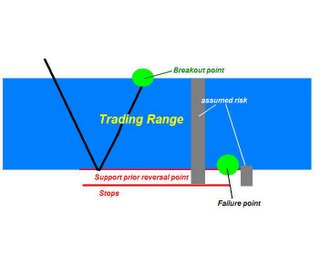
To me the prior potential reversal point provides the support (assuming the view is correct), the farther away I enter from that reversal point the more assumed risk I am accepting, ( because I feel that price can always retest this area and the view remain correct).


When I enter a trade I want to enter:

1) Primarily at what I determine to be the reversal point in advance, the first turn and/or

2) The retest of this point.

At this point my risk is the lowest possible and the time it takes for me to be out of risk is the lowest also. ??????????

Eliminating assumed risk.

From this reversal point as price moves away I will quickly cash in a portion of my position and snug my stops to just below the low, preferably to a breakeven + profit position. At this point I have pocketed some pips and the remainder of my position is a free ride to continue to the next turn and we start the process all over again, if my view is incorrect and I get stopped out I still make money. Which is what this game is all about, making money - not necessarily being right.

If I cannot enter at or very near the turn I will not take the trade, I want price to come to me and not the other way around.

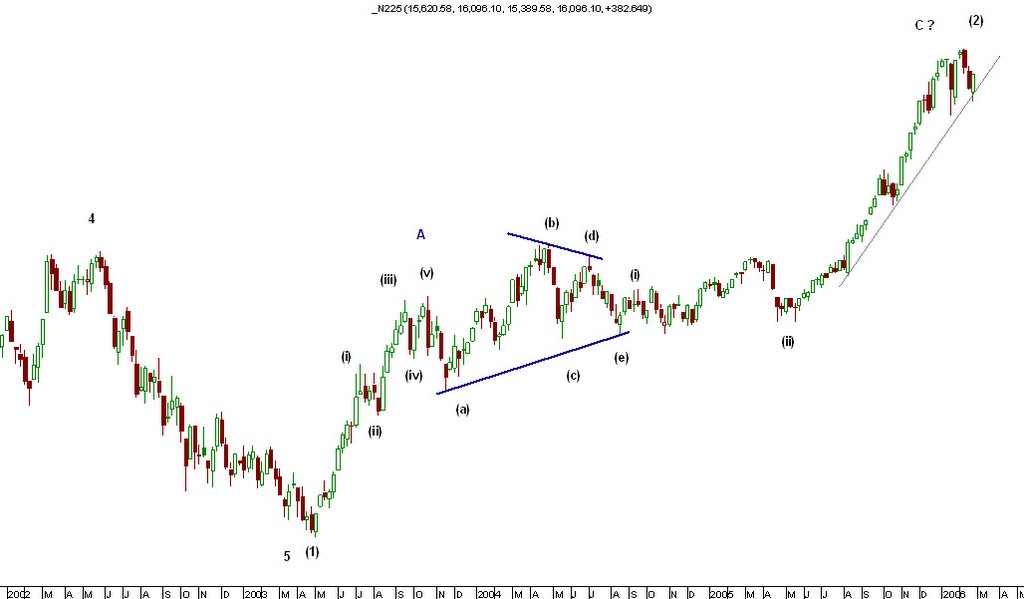
From your chart the other day on the long term Yen price had moved north to the resistance/downward sloping trend lines. This would be a point to trade south imo. North positions would be establish after either price had reversed off these lines or price has broken thru and retested the line. To enter now would leave yourself very vulnerable both price and time wise, to the extent that you trade could become profitable with protected stops.

In a nut shell we want to enter at a point that offers us the least amount of risk and time to get ourselves in a profitable position.

Sorry to ramble, hope this makes some sense.

Bear

Accepting WINNERS, accepting LOSERS

I absolutely agree with you Joseph and I'd like to add my comment to this.

If accepting your winners will make you a Winner, accepting your losers will then make you a LOSER.
DON'T accept your losers, unless you like feeling and being a LOSER.

The better way of dealing with your Market calls, is to LEARN to KNOW, when you are RIGHT and knowing when you are WRONG. That way at certain points you will always be Right, and instead of becoming a LOSER you will become WISEer.
I know that we are talking about subtle psychological nuances, but very important ones.
Why? Because there could always be an equal and even better opportunity on the other side of the call. If you look that way on the market, you will always be aware of the opportunities on the both sides. So at points when you argue with Market and it tells you "you should have listen, you are on the wrong side", you can always get on the right side and turn in Profit.
If you have accepted your Loss, you would've most probably needed some time before entering again, and that amount of time you need away from Market after every Loss could grow to the point when you Quit, simply because you either lost your confidence or your money.
Determine price levels that will tell - confirm you being right or wrong should be important part of your strategy from your Money Management decisions point of view too.
Managing your Risk will give you better chances of surviving, but we can't talk about Money Management if we didn't set a Realistic Goals first. Set your Goals first, then decide if you have better chances and opportunities here or you should try a Casino.
ID

My system, rules, timeframe focus and learning modus operandi

Underlying theme: "I don't know nothin!"

Rules: Don't lose money! (I disregard all the zillion rules I read @ MoneyTec and ignore ALL the bestselling authors I've read on this subject -- a boxer who gets pounded in training, arrives for the main event already emaciated internally! Live with the loss, yes, but happily lose while you're learning? .... categorically, NO, NO & NO!

System: Enter/exit when the Head says NO, but the Heart says Yes and the Soul demands it! ...... (all trading books/methodologies, including Elliottwave theory etc. only describe the outward manifestations of the "destroyer" that sits betwixt the Head and the Heart. For, without his presence, all messages from the soul and Heart would arrive at the Head uncorrupted and correctly and would therefore be perfectly executed resulting in there being NO game, for in essence the Soul in everybody is perfect -- & competition is only a means for the weak to distract the strong! All rules about discipline, theories and what-not really deal only with how to put a band-aid on this antediluvian problem plaguing us all" -- there's got to be a better way! Who/what is the "destroyer"? .... aka Ego, the Reactive Mind or whatever you want to call it. His modus operandi? ... for him to live, you must die -- put another way, "to destroy life, to create death!" That's why its never your broker, your analyst etc. that's causing your failure -- the culprit is within and in hiding and is clever, clever, clever!

Timeframe: Monthly/weekly/daily but for 2006 warmups, 4-hr chart + daily. Ignore 1-hr, 30-min and 15-min. timeframes.

Currency Trading experience: 2.5 months; finished 3-month demo trading on December 5th, last year.

How to accelerate/speed up the learning/practise curve with real cash? .. do my homework, make my decision/call and then post it on a bulletin board -- if wrong, I'll never forget the humiliation suffered, worse feeling than the loss of cash, and therefore will research my errors diligently and as a professional.

Year 2006 goal: On December 31st, I'll review my performance; if the return is not commensurate with the effort involved, I'll bow out gracefully and continue to do what I do best -- absolutely zip and enjoying it too!

:) :) :)

My results for entire 4-hr chart move (Jan 23 -- Feb 24)


Focus: 4-hr chart -- Dollar rally from Jan 23rd to current point, Feb 24th = 1 month.

Splitting the move into 3 parts: (a), (b) and (c).

(a) The Jan 23rd turn ...... 2 attempts at getting it right, losses reached $1,200 before I my view was respected.

(b) The actual ascent/rally was correctly envisioned...... & was therefore satisfying; result here is quite respectable. Nothing to learn from wins, so let's move on.

(c) The current turn (assumption = northbound rally for EurUsd et al presumed unless proven wrong): -- See the yellow ellipse in the eurUsd chart for where my troubles began on Feb 10th. So far 3-4 attempts at nailing this turn have produced very mixed results; pairs played are EurUsd, GbpUsd, UsdChf, NzdUsd, UsdCad & my chief savior UsdJpy!!! The broker has earned quite a bit from me on this turn as I got booted out often. After counting commissions and swap charges etc., I'm -$746 for this turn, i.e. I've not been paid for about 10 days of work, rather paid the boss instead!

My critique: Parts (a) and (b) are normal operating results, so there is nothing further to add.

Part (c) however has aged me more than Moneytec. And to add fuel to the fire, I nailed EurUsd yesterday with yet another purchase LONG in the upper 1800s. I've also added to my UsdJpy Short. If I'm wrong in calling a turn, my loss for this turn will escalate to about $3,000.

But that is my call and I'm sticking with it. I'm expecting wave C up of the Euro rally that started on November 16th.

My ex-wife once said to me, "you are the darndest stubborn ass*ole I've ever met!"

Yeah, but she was all lovey-dovey when she got half, hehehe.

Just a month in the life of a fella who loves the game!

NIKKEI 225 wave count

Hi Joseph
here is what I believe is a probable NIKKEI wave count.


On this chart is the Longer term NIKKEI action, and it seems to me that it touched the bottom in March 2003 and we are seeing a reversal from there on.
On the next chart is detail of the action from 2003 - today, but let just for a sec stick with this one.
If we were about to see the drop from Dec 1989 to March 2003 as an Impulse, then the Red horizontal line from the end of what could've been wave one, would be our invalidation point, and since NIKKEI broke above that point somewhere in Nov 2005, it invalidated the possible IM down, so we consider a finished ABC pattern. The move from March 2003 looks like an Impulsive move so we could have a potential reversal, or start of a larger Bull trend, but there's lot more for that to be confirmed. Even if we consider this move being a IM part of a ABC ZigZag, or being a ZZ it self, we still have min 22,000 to 23,000 for the first leg up (with this whole move from 2003 being only first wave A of the larger first leg that will finish up in the red box)). It could possibly finish the correction but in my opinion that is less likely.


On this second picture is how I would label the move from March 2003 up.
We could have finished III on the place of sub ((3)) on the Chart, meaning we are in a IV before a final V. But shown on the chart is how i prefer to look at it.
Recent top however, fits almost perfectly for a finished ZZ.
The blue line is the invalidation point for this IM wave scenario.
Take care
ID

Friday, February 24, 2006

Market Update 2

EUR
Should stay below 1.2045/55 to continue down to 115<>114 price levels.

GBP

prev: "GBP could stay above recent low in GBP and correct to around 1.74<>1.76 (7433 and 7545) before it continues down to mentioned prices."

Reached the previous post target, now above recent high at 1.7555 up to 1.7662.
On immediate continuation below 1.7440/20 and 1.7281 to retest 1.7047 but probably to continue to 1.69/68

Both GBP and EUR are set for a possible continuation down, but could correct further up.

CAD
Probably down but from 1.1543<>63
Above that 1.1635 to 1.1720

Gold down to 538.4 and blow that to 514.46/513.05
Crude probably one more leg up to finish correction, should be limited to 63.20<>64.40 then down to 50 targets (details posted in other posts)
ID

Note: mind possible news spikes which should not be taken into consideration.

Market Update

First USDX and JPY other to follow later.

USDX
Good levels but wrong timing in previous update..
Made a low at 90.09
Probably it will go down to 89.7 if not lower. Should stay below 90.60/70
Above that, could be a good sign of a continuation above the 92.6 high
On the downside, as in previous update, failure to break below 89.70/60 could be a good indication of a possible continuation above 92.6 top.
Below that, probably to 86.3
Intermediate term still UP.

JPY
previous post(s) still on.
Should stay below 117.40/60 which is the second target up for the ongoing correction, with 116.9 being first one.
I'm confident for at least 115.70/40 being first target down, and second down around 111.80/40 to 110.60 to 109.73>109.38/23
Intermediate term, if this drop goes below 110.70/60 could be a good sign of intermediate top in place @ 121.37, and the correction from that level would be limited and would not exceed this top. Longer term Down.
ID