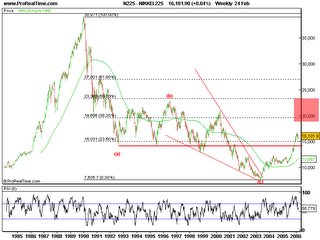
here is what I believe is a probable NIKKEI wave count.

On this chart is the Longer term NIKKEI action, and it seems to me that it touched the bottom in March 2003 and we are seeing a reversal from there on.
On the next chart is detail of the action from 2003 - today, but let just for a sec stick with this one.
If we were about to see the drop from Dec 1989 to March 2003 as an Impulse, then the Red horizontal line from the end of what could've been wave one, would be our invalidation point, and since NIKKEI broke above that point somewhere in Nov 2005, it invalidated the possible IM down, so we consider a finished ABC pattern. The move from March 2003 looks like an Impulsive move so we could have a potential reversal, or start of a larger Bull trend, but there's lot more for that to be confirmed. Even if we consider this move being a IM part of a ABC ZigZag, or being a ZZ it self, we still have min 22,000 to 23,000 for the first leg up (with this whole move from 2003 being only first wave A of the larger first leg that will finish up in the red box)). It could possibly finish the correction but in my opinion that is less likely.
On this second picture is how I would label the move from March 2003 up.
We could have finished III on the place of sub ((3)) on the Chart, meaning we are in a IV before a final V. But shown on the chart is how i prefer to look at it.
Recent top however, fits almost perfectly for a finished ZZ.
The blue line is the invalidation point for this IM wave scenario.
Take care
ID

No comments:
Post a Comment