Wednesday, March 01, 2006

Nikkei: EW study continues .....


ID,

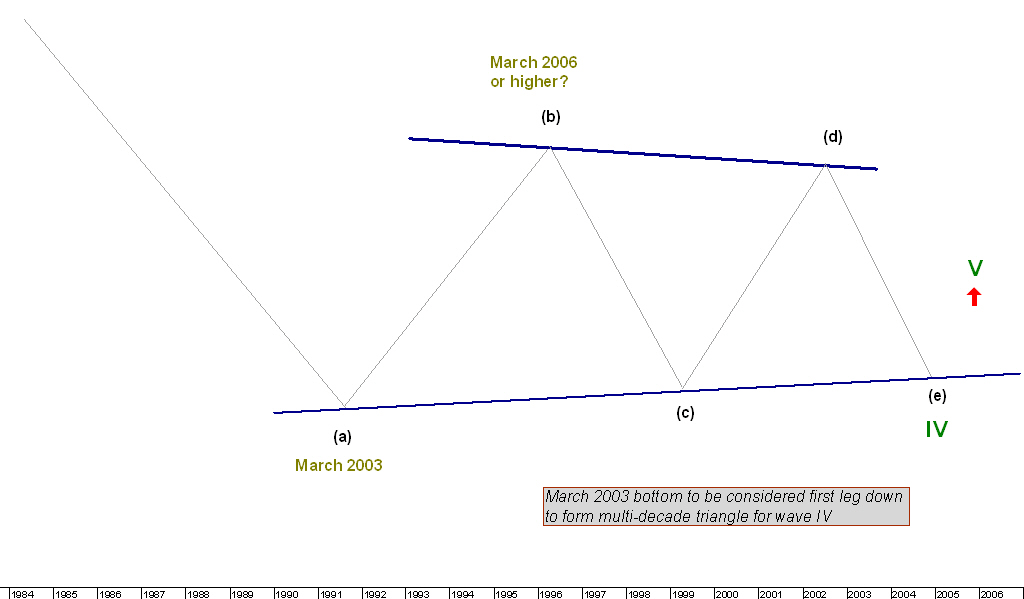
alternate: A large wave IV triangle that spans decades is the appropriate punishment for 200 years of bullishness, 2 world wars and millions killed in Asia. If I was calling the shots, I would have China gobble them up -- but there's always the possibility that Uncle George might just make them the next state. :)

OK, thanks -- the (a) (b) (c) longer leg view is now clear as to what you had previously meant.

Regarding your valid point about wave 3 being only 100% of wave 1, which would therefore bring Nikkei close to zero-- not impossible, but unlikely? .... see my take below ...

It soy-tenly can! Wave 3 can terminate a market at zero and bankrupt it regardless the Fibonacci ratio matching up at the point of death -- to see the full extent of the damage one would have to continue on into the afterlife to see the actual termination point, hehehehehe. :)

A country that has started 2 world wars, slaughtered millions in Asia, still predominantly bullish for the most part -- a country with the likes of Honda and Toyota still in raging bullmarkets -- after just 13+ years of correction of the whopper prior run, they're now in a new raging bullmarket?

If so then their bearmarket has been more like a picnic. :)

If everybody agreed on the count there'd be no fun -- ... said the englishman to the indian, "its very strange that you have so many clocks in your house -- all showing different times!" ..... replied the indian, "no, my friend, what would be idiotic would be to have so many clocks all showing the same time!"

USDJPY: An alternate count!


Still inviting analysis from others, but kindly be more specific as to your caveats etc. -- a chart showing your points is preferred.

We are still only talking about the long-term view -- let's not mix this up with trading views.

See the 2 yellow ellipses in the chart -- the first is a definite triangle, the second is also a possible triangle but I'm not yet convinced.

Presented are my 2 counts.

Action between 121 and 100 will certainly give me the clue as to whether UsdJpy will break the heavy resistance @ 121 or take out ultimate support @ approx. 100.

Somewhere between now and the next few weeks there should be a revelation in this regard.

Until that time, no long-term funds are being placed.

Tuesday, February 28, 2006

Market Update - 28 Feb 06

USDX
Down to 89.90/70 to 88.7. Below that down to 88.05 to 87.22
Above 90.40/65 continuation above 91 and above 92.63

JPY
Now it is right on target (I expected 115.5)
Down to 113/112.90
Above 117.80 could be first good indication of a continuation above 121.38 top, if it is to continue down then this ongoing correction would most probably stay below 116.80/90 my preferred view is still down but changed in the part that this whole action from the 121.38 top is not clearly a reversal pattern so we could expect to see a continuation up above the 121.38 top from some of the lower levels.

EUR
above 1.1950 to 1.2 to 1.2025 to continue down
below 1.1890 to 1.1825 to continue down to 1.15/14

CAD
down

GBP
Above 0.7436 up to 1.7655 to 1.7700/7750
to continue down to 1.69/68 to 1.66

AUD
Above 0.7436 up to 0.7480/85 to continue down.
Below 0.7385 could indicate down to 0.67 - Below 0.7350 is good confirmation
So could be a low risk short from either current levels or little above @ 0.7480, preferably second. Also breaking below 0.7410 will be a first sign of weakness.

Bear: Long to short ratios could be used as a good contrary indicator, since if you see the Open Trades summary on Oanda, there are never more than 15% of all open trades in profit.
In fact since we spoke yesterday, Long to Short on CAD move to even More Net long, and the profitable positions fell from just below 10% to now around 5%

Axiom #1: The secret is to go sideways between the home runs

...... and not lose much during periods of market indecision.

That is what I did -- took a few days off, had a ball and did anything but the market.

I have alot of catching up to do as I see many new posts.

Just to let you all know that I've not forgotten about your contibutions on my UsdJpy long-term play postulates; this week I shall be going thru' the charts again and will post answers to ID's piercing EW questions.

Doing an EW analysis is a time consuming effort and anybody who helps me out in this endeavor can rest assured -- I'm in his debt -- and can call it in anytime.

Risk: Playing it safe is dangerous!

Rule #1: Don't lose money!
Rule #2: Playing it safe is dangerous.

An update:

Positions unchanged; EurUsd (Long) from Friday made a new low, but UsdJpy (Short, also from friday & earlier too) is paying handsomely for my coffin, which, after reading Bear's call, suggests that this might be a good time to visit MoneyTec, socialize with the cuddly, exasperating winners that live there and get some fundamental data on coffins and burial sites.

My call? Still the same -- EurUsd, GbpUsd etc., heading north to close out the rally that started November 16th. After the rally the $ will decimate every mother's son on the planet as he heads for 96-100 (USD Index).

What can I say? Hope I'm not wrong; but if so, I can turn on a dime and go with my buddy.

Rule #1: "Don't lose money!" ... continues to thrive untrammeled!

Rule #3: "Make money!" ..... continues to teach me the lesson of "market patience" as I've made zip since Feb 10. Although nicely profitable for the entire move from Jan 23rd, the turns are where the fun is and this particular one has shown me depths of deceit that ain't even been discovered yet, hehehehe.

Why I answered this newspaper ad, I'll never know -- "Men wanted for hazardous journey. Small wages. Bitter cold. Long months of complete darkness. Constant danger. Safe return doubtful. Honor and recognition in case of success."

:) :) :)

Wave and Cycle observations

Idejan,

Just woke up and checked the charts…………………….

Your thoughts on wave theory and I have to throw in natural fibonacci ratios and cycles are evident throughout everything in life. The one thing that is certain is that things will change, give and take, up and down, good and bad………..

These cycles are even evident in our own trading and our decision making.

It’s obvious to me that my views of the markets are in a corrective mode atm…….There are times to trade large and times to small or not at all…… and nows the time to trade lightly and preserve capital, for the next few days, imho.

One of the best lessons ever taught a novice Bear was this (trading) is not a sprint race it’s a marathon. Some times it’s best to draft, and I think in regards to trading, the winners are the ones who know when to take a rest.

Long CAD? Everyone else is doing it.


"When Alexander saw the breadth of his domain, he wept for therewere no more worlds to conquer."

Just the sight of this chart makes me want to go long, I guess it makes everyone else want to also. Earlier had commented to Idejan that on the long/short indicator on the blog showed 100% short on the swissy.

He informed me that some of the other brokers were showing near 100% long on the Cad. And indeed checked the open long/short ratios at OANDA, sure enough it’s way up there, so my dreams of slaying the market were dashed.

Still took out a small position long……

Just a bear brained thought,....... when everyone is going in the same direction, it’s time for a reverse….. for there’s no one left to take the other side.

Elliott Wave Principle

The Mighty Wave Code :)
This is for all true believers to strengthen their faith, and for all those non believers to convert em into Wave Principle followers and believers :D

This goes even beyond my faith and fascinations.
Simply put, Amazing.

Remember. We are talking here about a small private party, with very few participants, and yet you can clearly see a text book WAVE PRINCIPLE in ACTION.

What can I say. I might be missing something or am I overdosed with EW and I'm seeing things? :)

Not shown here, but interesting to mention is the fact that in the fifth wave on the chart, while number of Readers made to that new High (5), number of page views diverged and made lower high. Typical for 5th waves (more participants, less participation - volume; and divergence in oscillators).

As seen on the chart first drop made to exactly 61.8 fib, then retraced typically for ZZ corrections 50% (55% exactly) of the first drop from the High, and the next drop was exactly 100% extension of first drop A from the B or as on the chart C=A.

This goes as wallpaper on my desktop to remind me of how true Wave Principle is.

Joseph, you could send link to your friends at EWI :)

ID

A view to a funeral or a funeral for a view


He was a cowboy, mister, and he loved the land. He loved it so much he made a woman out of dirt and married her. But when he kissed her, she disintegrated. Later, at the funeral, when the preacher said, 'Dust to dust,' some people laughed, and the cowboy shot them. At his hanging, he told the others, 'I'll be waiting for you in heaven---with a gun.'"


As I was looking at my view of the Euro I was reminded of a funeral, so I searched for a good quote that would symbolize my disdain. Searching thru the many quotes under the heading of funerals I came across this one. Seeing as we have had many illustrations of the old west I thought this would work, made me laugh anyway....

The Bear is lost in the forex, atm....

Price has broken the fork and the parallel, and now looks like its poised to drop farther south, the charts should tell the story.

A series of relabeled charts

Now am beginning to think that we may be in the 5th wave down, and if that's true will be hard pressed to find a good entry south, (we needed to jump on this wave back up in the 2300 area) so scalping hats may be on for this final descent.


One of the problems I have had is labeling some of the minor 5th waves

Here intermediate 1 & 2 seem obvious, but trying to count 5 on the 3rd I come to this conclusion.


To end the count for the 3rd wave back in June, its hard for me to count 5 waves, so I allow for the 4th (retrace) and then end the 3rd wave in December ( red boxed area ).

If any of you were following back on the Moneytec thread I was looking at this as the end of intermediate 5. But here again, was hard pressed to put the final 5 of 5 tag on anything.

And again finishing the 5th of 5 of the 3rd I'm forced to label here. Which leaves us the 4th wave as shown.


I was really expecting the low of the 2/16 (1.1848) candle to hold and to start the "C" wave north of what I thought was a larger correction which would have been defined by the yellow fork. However with the low being taken out this leaves the door open for more south in my books.

One problem I have with this view is the simularity between intermediate waves 2 and 4.

I do show a time for reversal coming up mid to late week but I think we will be slowly dropping for the next few days, however Im now beginning to think that any euro strength will be limited and confined in the black fork, which will be the opportunity to short.


Here's my hourly Im looking at looking to finish this 5th with the completion of the 4th wave triangle.


Still trying to put the pieces back together, will post later with a cleaner view. May need to look at this as a larger corrective move.

Have some more thoughts on different pairs, back in a bit

Sunday, February 26, 2006

Joseph: Good point on NIKKEI, tnx

Joseph,
Excellent point on the triangle.
I had problem labeling prior move up as wave I up, but your point with triangle put more shade on that view.
However, I would not label this whole move up as being wave 2 of a larger (c) down, but rather I'd consider it a possible fist leg (a) of a lager ((b)) since to me prior (a)(b)(c) pattern looks like a finished larger wave ((a)) (first chart in NIKKEI225 post).
And as I wrote in my NIKKEI post, even that this is not an IM, the last move up is IM wave and it has one more up to finish what would then be wave c of a larger (a).
Break above the 16,777.40 top would confirm this last IM wave 5 to finish c. Then we should see if the next drop will stay below that new top for same degree correction wave (b).
The fact that it drop to 78.6 fib is also a good indication that the whole drop could be at least considered finished fist leg if not finished correction.

Taking this as wave 2 of a larger (c) down, with wave 3 being only 100% of wave 1, would get NIKKEI down close to ZERO value.

Not impossible but less likely.
Let's see how it unfolds.
ID

PS. I would not be surprised if move from 2003 unfolds being an IM wave up after all :)