Wednesday, March 08, 2006

EURUSD: details on my wave C (up) call!


Caveat: The market will tell me and you whether I am a shmuck or a sublime lover -- when? .... we'll know soon enough. I'm ready for both outcomes but prefer the latter and have a bottle of Sake ready if the former decapitates my pride.

Let's get on with it then, shall we? See chart. Stoploss line is just below wave 1 beginning @ either 1.1833 or 1.1825.

Wave C has been underway from Feb 27th low of 1.1825 or Feb 28th low of 1.1833.

The current colossal drop is wave 2 down. Don't know whether this wave 2 is a complete abc or whether it is only wave (a) of 2.

Either way I am in and positioned for love or a kick in the ass.

I remember my own writing about the devilishness of wave 2 and how every mother's son expects the previous bearishness to continue. This is the time for the individual to rise above the crowd thinking and walk the road alone, lonely as a son of a gun, with trepidation and his own internal destroyer wreaking havoc on his well-being. Such is life; it can be a bitch during such moments.

I therefore take my stand, hold my ground and wait!

Tuesday, March 07, 2006

USDJPY EW videos

Here are the links of the EW Video Analysis on USDJPY.
It is in two parts, has a low quality audio, but I believe it will do.
I will try the next one to be with better audio.
Here are the links:

USDJPY Part 1

USDJPY Part 2

Tomorrow I will continue with the analysis on the recent Development and since I was asked how I do my calls, I could shortly show that on the last calls from 28 Feb Market update.
It will present the other part of my TA, my MAIDs and my modified RSI.

I sincerely hope you will find this videos useful, I know that labeling would have been a great +, but it would have taken considerably more minutes and would add to the size of the video.
I just hope that you can handle my presentation and I'd appreciate comments and questions.
I once again apologize for the low quality audio, that was the main reason this wasn't published yesterday. Hope to be able to find the best quality to size solution and to clear the interferences that are creating the noise, for the next video.

ID

EurUsd: original call -- wave C up -- still very much alive.

My call of wave C up is unchanged!

Just hammered in some LONG ...... EurUsd at the very lows.

First sign of reversal and continuation north will be greeted by more purchases.

But for now, I'm IN!

Update


Never got the chance to get back in south and my north wave 2 folly got me nowhere, price has found some support back on the bottom tine of our previous daily fork, looking to get back short from a retrace.

Hope everyone's having a great day


Idejan, some good points on wave trading. Thanks.

well, it looks like Im back to being unable to post a pic again (it's blue because i'm sad.)


It's Fixed :) What's a happy color?

EurUsd: 4-hr move from Feb 27th

A samurai weapon -- apply to current EurUsd 4-hr chart rally from Feb 27th.

In Hollyweird it would be called Thunderlips.

aka "Trendline by angle"

Observe that the rally thus far scores 51 degrees angle of ascent, aka angle of attack. I believe virility of this calibre must be respected by all women. The current correction on the 4-hr is therefore a regrouping and recharging of the seminal vescicle.

Can it be a dud? Yeah, in which case it would be tantamount to using Viagra, which in my book, is cheating and earns my scorn. In this event, I be wrong and bow out gracefully.

If wrong, then let it be known that I came so that the Scriptures may be fulfilled!


Testing to see if I can post a picture

Here's the pic of the CAD from earlier.

The compose and edit functions are still kinda buggy.

Euro Update

Idejan and Joseph,

Here’s a couple of screen shots, that show my current thoughts. From last week price has found resistance on the black fork, Thinking this is the 5th that has been discussed earlier, ( I know you two are thinking that this current drop is a corrective wave, and I may agree to a point however I believe that the correction is much larger than shown 5 down, 3 up and 5 down perhaps??)


On the hourly, Don’t faint Joseph, as I mentioned earlier, have been trying to long on a retrace of wave 1. If my thoughts are correct, price will make the red box and reverse south setting up a 3rd wave down, and should be a good one. Price is making a small H&S on the hourly, and if price fails to meet the top of the upward sloping expanding channel ( if will have to storm north to do so) would show weakness in the euro, imo. Might add my north trade has not netted many pipola’s basically trying to catch what I can of the retest to enter south again. Would like to see at least a 50% pull back and will start to scale in longs again. Upper tine of the black pitch fork will be my failure point.

Joseph your C correction may be valid still, as price is still within the two major forks, but so far price has respected the south. One of the two will have to give soon, and price’s direction will be known.

Monday, March 06, 2006

CAD??

Joseph,

Running like the ole' chicken with it's head chopped off today, will post some charts this evening, Idejan was wondering my thoughts on a possible Eur top, but I couldn't help but take a break and post this....

Time for a retrace, but do think we are putting in a bottom, time will tell.

for some reason I can't add a pic, will try to edit later

Finally those EW points

I’m starting with the Note I posted to Joseph on his questions about longer term USDJPY view simply because in my opinion it is the most important thing you should focus when analyzing Charts.

Corrections, can start with both Impulsive action (A and C of a corrections can be IM waves) and Corrective action. But Reversals can only start with Impulsive action, and wave One could be either IM or LD (Leading Diagonal) in both cases the internal structure is 5-3-5-3-5 with the difference - possible overlapping if LD. LDs are rare.

A correction in the above note is …Reversals and Continuations can only start with IM...

When you analyze your charts, what you are interested in is finding OPPORTUNITIES.
First thing to learn in EW even before how to label a chart, should be that the only waves you would like to trade are MOTIVE waves or better said IMPULSIVE ones, and depending on the scale you would either trade the whole moves or only some of the actionary subwaves 1, 3 and 5 of the IM.
This is simply because they are more predictable and provide larger directional moves, thus presenting a better Risk to Reward opportunities (lower Risk to greater Reward potential).
Correctional moves are difficult to both predict and even more difficult to trade.
An exception could apply in cases where A and/or C are IM waves.
Since we all know the basics of EW no point on explaining them, but out of that basics comes a simple conclusion.
Motive waves move in a five wave structures and corrective in a three.
So either way there is a third wave always.
And since you need at least two points to determine direction, that is why the best waves to trade are 3rd waves of an IM and Cs, especially when C is IM itself. This also because ZigZags correctional patterns are prety much same with IM since thay have internal structure of 5-3-5 but the diference is that they are 3 wave structures, so the next 3-5 will not happen and that can full you.

What I will present here is something you all know, and is very very simple, so simple I'm not sure I sould be writing about it. But this in my opinion is the first and most you should know of EW when analysing Markets looking for opportunities.

When we are looking on a chart we are actually looking at/for either:

  • Reversal of the trend
  • Continuation of the trend
  • Or Correction of the trend

(since I was chatting in a room, this took more time to write so I’ll make it short and then explain if there are questions)

  • If we are looking for a Reversal, we will look for a finished IM wave and IM wave started after it but in the other direction (one of a smaller degree). Problem here is because the next returned IM in the other direction could be either wave 1 of the reversal or just a wave A of the correction. That is why it is better to wait for a confirmation.
    Answer on this dilemma lie just below the previous IM end (top or bottom) and after the next IM wave (in opposite direction) is finished the confirmation is above that wave high.

  • If we are in a Continuation, than we want to see a finished IM wave followed by a correction. This is excellent indication for a continuation above previous top (or below bottom)(exemptions are failed or truncated fifths).

  • So as mentioned in previous case, Corrections are only good indication of a continuation of a previous trend. But you can also trade the 3rd waves of the corrections labeled as C waves, as they provide same or similar opportunities as 3rd waves of an IM because they can develop as IM waves too. C waves of the Flats and ZZ must develop as IM waves.

This is the essence, no matter how you label the charts, this is what will give you the most important answers and will help you find the best opportunities on that charts.

I’m preparing a video for USDJPY questions. Link coming shortly after I manage to pack it in reasonable size.

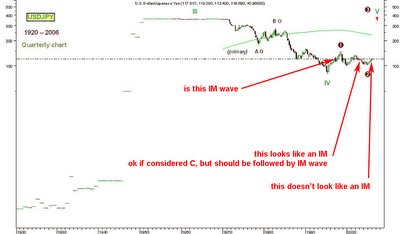
Below is the Joseph's Long Term USDJPY and 3 points of consideration.

On the second (ok if considered C but should be followed by IM... should add ...or followed by D)

Addition to the 4/1 overlapping post should be that overlapping in Impulsive waves is also possible in two special cases: Leading Diagonals and Ending Diagonals, which are type of Triangle formations but with steeper advancing slope. LD could develop in wave 1, and ED in wave 5. Difference between this two are that, while ED have internal structure of 3-3-3-3-3 same as corrective waves, LD have 5-3-5-3-5 IM structure with typical overlapping.

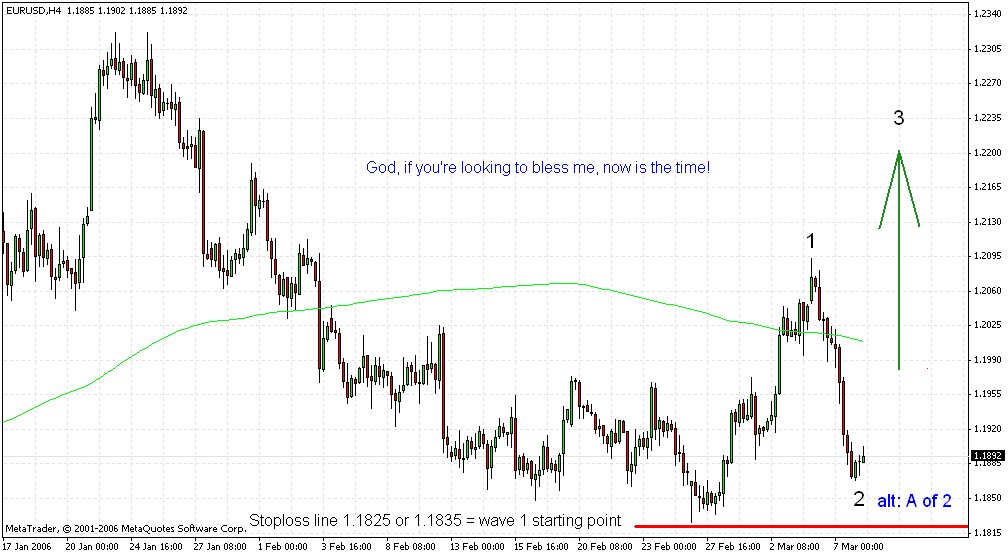
Last calls from 28 of Feb, came out nicely, but unfortunately I was not able to publish a follow up on them.

ID


USDCAD: Look Ma: you told me there'd be days like this!


:) :) this is getting more and more hilarious. Witchcraft! voodoo! What will the fundamentalists say?

But wait, here's a thought -- others feel free to offer some arguments for and against, OK?

so far, textbook bounce off daily macd/RSi trendline support -- in this case the Macd fired first -- but also the FE 161.8%. Currently at FE 100% resistance after also hitting 38.2 fib.

My analysis tells me this is a wave iv and that we've got to go back down for wave v to the 161.8% level @ 1.1300 or thereabouts again.

That will be good temp bottom. This is MHO.

But some of you may feel that the rally is going to just continue and not return to the 1300 area.

Well?