KNOW WHAT OTHERS DON'T
Welcome to my Market Directions ramblings.
I mainly focus on Major Forex pairs.
The idea is to grasp Intermediate to Longer term market moves.
I use different aspects of Technical Analysis and I take into consideration economic news data, but just in conjunction with my technical analysis.
Comments and criticism are welcome as long as they are constructive and will help both readers and me to improve our understanding of markets moves.
Friday, March 10, 2006
Joseph: divergences in 3rds
This chart was prepared for that previous post, and I was confused when I saw your post today, since I was not aware I've missed posting it.
So here it is, and as you can see I agree with your observation about the divergences in 3rd waves, actualy as I wrote in previos post in my observation, 3 wave cycles are not producing divergence and any 5 wave cycle (which means not only IM) are giving divergence.
Divergences in the substructures are reflected too depending od the degree and the time frame you are observing.
I haven't done a study on this, but when I've mentioned observing patterns on RSI I was reffering to this.
I dont have MACD on my charts so I can't speak much about it but it is clear to me that you can't play divergences on their own, but reather use them for inforcement on price patterns.
Now Joseph, I became aware that there are questions I've missed answering, so if it's not too much of a trouble to you, could you please mail me all of the questions by mail so I can have them addressed one by one.
Dejan
Myth busting # 3 (contd) Fed funds Rate
How did the moron try to kill a bird?
He threw it off a mountain cliff !
-----------
See my earlier post on Fed funds Rate going way, way up into the clouds.
And what were the geniassssses saying then? 4.5, perhaps 4.75 tops and then we go down, down, down!
What are they saying now?
"Over the course of the current tightening cycle, many market participants have been repeatedly surprised by the magnitude and duration of the Federal Reserve’s action. Several times the market has gotten it into its collective head the Fed was done — including in the immediate aftermath of Hurricane Katrina, or the “one-and-done in 2006” sentiment — only to reverse itself later. Analysts are now forecasting additional hikes to the 5.00-5.50 percent range before this cycle is over."
Why can't a moron dial 911?
They can't find the 11 on the phone!
Myth busting # 4: Trade Deficit & USD
If you mow your lawn and find a car, you're a redneck.
But a Moron? .... that's a whole different ballgame .....
Why did it take the moron an hour to eat breakfast?
Because the orange juice carton said, "Concentrate!"
How many times have I heard the dollar's problems blamed on the Trade Deficit? Hundreds of times ... and by every single major News org and TV station to boot.
Recent examples: (plucked from EWI site; I have my own charts on this subject but their's are superior, so I present it here instead of my own)
“The US trade data for January is due on Thursday and may trigger some selling if it draws attention to the structural problems facing the US economy.” (AP)
“With expectations for a wider-than-expected result in the US trade gap, there is enough scope for disappointment, making the dollar vulnerable.” (Forbes)
“The widening of the US trade deficit was a key factor behind the dollar’s three-year decline through the end of 2004 and currency analysts warn it may send the US currency falling again.” (Reuters)
EW lesson 1 ... (contd) .. divergences before wave 5!!!
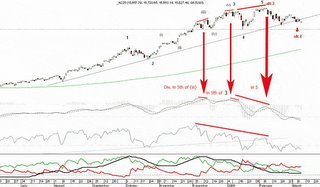
I know quite well about divergence showing up in wave 5. I am talking about subtle divergence showing up BEFORE wave 5 -- actually at the very end of the 3rd of 3rd.
There is NO Elliott rule on this, I am sure, but I was asking if you personally had observed any such occurrence?
I have, actually -- in spades, and would very much like you to give it some thought over the next several weeks, if you haven't already.
Here's the gist of it: (refer to uptrend as an example)
The 3rd of wave 3 produces maximum impetus which is clearly visible on Macd histogram, Macd and RSI(14). Then, when the actual wave 3 completes, generally there is a clear negative divergence already showing on these 3 indicators. So, actually this is the start of the divergence -- it actually starts right after 3rd of 3.
Then wave 4 generates a lower low usually and shows larger displacements on the histogram, Macd and even RSI generally.
From this huge drop in momentum, it is easy to see why wave 5 delivers the final divergence. There is just too much ground lost for it to make up, especially considering the fact that it is a terminating wave.
My point is that we've got to look earlier than wave 5 for the point when such divergence is actually being born!
EW lesson 1 continued .... answers requested.
Please see the same chart of Nikkei daily from March 2003 bottom.
(1) Yes ID, the black count is same as your count. OK, no problem here.
(2) Here's what I meant by the drop -- refer to the drop from the Feb 2006 highs. Keeping the degree of tend the same, i.e. Minor waves as shown, I was not sure where wave 3 ended -- January top or is it the February top. Sorry about the error in communication.
So, to repeat; could the Feb top be the top for wave 3 instead of the January top? This would mean that we are now in wave 4 down, with wave 5 yet to come.
Please clear this for me.
Thanks amigo.
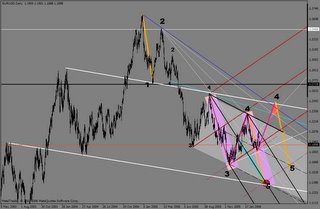
EURUSD: wave 1 or A -- my answer to Bear's question.
This was my thought process -- humbly submitted. Don't know how many EW rules I'm breaking here, but ID can set me straight on this score.
Joseph's EW#1: Within the structure of the supposed wave 1, if there is no clearly discernible (ii) and wave (iv) looks like a picnic, plus the lack of any wave iv within (v) of 1, I smell a rat and this noxious smell usually is the malodorous, soon to be coming to life, wave B, farting in advance of initiation.
Joseph's EW#2: Look back to the corrective drop in early 2004 within the previous bullrun -- if the 2005 drop is wave 1, it is as dubious as a one-legged man in a butt-kicking contest! ..... especially considering the long 4-year bullmarket, one would expect a true wave 1 to kick better ass.
Joseph's EW#3: First waves aborn out of BASING structures and sometimes even in these bases they are hard to distinguish because they never rise out of the base and get hammered by wave 2 within the base itself. This type of wave 1, I call a faggot because wave 3 then has to do all the work while wave 2 thoroughly buggers wave 1.
The other type of wave 1, also out of a basing pattern, is a sight to behold -- this is a different animal altogether. Even on the chart this type of wave 1 looks exactly like an underpantless gigolo who's just seen a beautiful, sexy woman with lots of money.
There was no basing pattern in 2004, therefore this is one more point I used in the elimination process. Odds here heavily favored a wave A in my book.
Joseph EW 4: Wave 1 has a definite tendency to whack the uptrendline; at least put a dent in the sucker. If this was a wave 1, he kissed it, fondled it, got his sacs emptied and then rebounded -- here then is another reason why we are dealing with an A, because wave B of A is next -- the perfect setup for Euro bulls to buy the dip and go Long ..... to eternity, hehehe.
I speak only for myself -- and keep in mind that I've been sent here to blow my account to smithereens & to ensure that the Scriptures are fulfilled! :) :)
On a more serious note:
actual confirmation that we are not dealing with an OVERALL impulse wave for the entire 14 month run starting from December 31, 2004 is further confirmed only in hindsight by the following points:
(1) If the first drop was a wave 1, then the subsequent wave 3 into July 7th, 2005 was a mellifluous pussy. Why? Because even Jack was still bullish the Euro. No recognition in the 3rd of 3rd that "hey, this is dangerous, something weird is occurring" -- I'm going to get buggered if I don't reverse and jump on the train. I'm going to be left behind." None of this type of thoughting, thunking or whatever.
And what's been happening for the last several months, since the July bottom, is the characteristic limp dick wave B, fooling everybody with divergence galore, making all kinds of noise to mask the truth that he can't get it up. The reward at the end of this charade? Full retracement by big dick wave C to under 1.0000!
Adios!
Wave impressions
Thought I’d throw up a chart I have running in the background with the two predominant views, and ask a question for you Elliott Waveticians.
One of the points that was brought up in the Videos was the fact that reversals start with impulsive/motive waves, and that appearance has a lot to do with nomenclature.
Looking at this, maybe it’s just me but this euro fall from the start of last year, looks impulsive?????
I know there are many counts regarding this as a corrective wave, and using the old adages “you can’t tell a book by it’s cover” but “if it looks like a flower and smells like a flower, chances are it is a flower, ummm - motive wave? :)
Thursday, March 09, 2006
Nikkei answers
Hi Joseph, Bear
The Alternation of waves 2 and 4 is not a rule it is a guidance, something to have in mind anticipating what could happen in a wave 4.
On your NIKKEI chart, ...but first let me just find something... A lesson I got from you :D..just a sec...
Here it is: Elliott wave counts work flawlessly only in hindsight! :D
Now back to your NIKKEI Chart.
If you go back to my NIKKEI chart you will see I labeled that part of the chart as your black count.
"My reason for the alt: red count is that the drop looks like a wave A and is not a 5-er"
I'm not sure if I understood this. Not sure what drop do you point and why it should be a 5-er.
Since you are analyzing a IM up, non of the drops must be an IM 5-er. To all of the drops on your chart, rules and guidances of the Corrections apply.
I'm not sure how would you label that alt. 3 if it is higher, his internal count?
On the part of your explanation about divergences in 5th, in my modest experience divergences show only in 5 wave structures, which means that beside the 5th of IM, they can show in parts of the corrections that could have 5 wave structures too.
as for the next questions on wedges.
Wave 4 can be any correctional pattern. So the answer to your "can the wave-C part of a wave 4 end in an EDT" must be searched in the rules for the waves C of the every different corrective pattern. Let see them:
ZZ
Let your eye and intuition decide. Then if any doubts check rules. No way you can process all the rules and counts unless you trust what you already know, your intuition.
If it's easier for you, than try not searching for the Right Pattern, but for the Most probable one.
And as i mentioned many times, beside the fact that if you do your analysis well, EW will give you the right or at least the most probable Direction, the second most important thing is that you can tell at what point you are wrong and consider the next probable scenario.
Try to look for opportunities and not to be right.
As for "We also know that B waves cannot end in an EDT. Am I right so far"
since LD and ED are considered a special case of Motive waves (advancing) wave B cannot be either of this.
ID
Problems with audio solved.
video continuation to come.
The Alternation of waves 2 and 4 is not a rule it is a guidance, something to have in mind anticipating what could happen in a wave 4.
On your NIKKEI chart, ...but first let me just find something... A lesson I got from you :D..just a sec...
Here it is: Elliott wave counts work flawlessly only in hindsight! :D
Now back to your NIKKEI Chart.
If you go back to my NIKKEI chart you will see I labeled that part of the chart as your black count.
"My reason for the alt: red count is that the drop looks like a wave A and is not a 5-er"
I'm not sure if I understood this. Not sure what drop do you point and why it should be a 5-er.
Since you are analyzing a IM up, non of the drops must be an IM 5-er. To all of the drops on your chart, rules and guidances of the Corrections apply.
I'm not sure how would you label that alt. 3 if it is higher, his internal count?
On the part of your explanation about divergences in 5th, in my modest experience divergences show only in 5 wave structures, which means that beside the 5th of IM, they can show in parts of the corrections that could have 5 wave structures too.
as for the next questions on wedges.
Wave 4 can be any correctional pattern. So the answer to your "can the wave-C part of a wave 4 end in an EDT" must be searched in the rules for the waves C of the every different corrective pattern. Let see them:
ZZ
- wave C of a ZZ must be either an IM or ED
- if wave A of a ZZ is LD then wave C must not be an ED
Flat
- C must be IM or ED
Triangle
- C of Contracting Triangle can be any correctional pattern
- C of Expanding Triangle must be a ZZ based pattern
Double and Triple ZZ
- wave C of W cannot be a failure
- wave Y must be a ZZ
- Y must be equal or greater then X by price
- wave c of Y cannot be a failure
- wave Y must be grater than 90% wave W by price, and wave Y must be less than 5 times wave W by price
Double and Triple Sideways (D3 and T3)
- wave c of W cannot be a failure
- wave c of Y cannot be a failure
Let your eye and intuition decide. Then if any doubts check rules. No way you can process all the rules and counts unless you trust what you already know, your intuition.
If it's easier for you, than try not searching for the Right Pattern, but for the Most probable one.
And as i mentioned many times, beside the fact that if you do your analysis well, EW will give you the right or at least the most probable Direction, the second most important thing is that you can tell at what point you are wrong and consider the next probable scenario.
Try to look for opportunities and not to be right.
As for "We also know that B waves cannot end in an EDT. Am I right so far"
since LD and ED are considered a special case of Motive waves (advancing) wave B cannot be either of this.
ID
Problems with audio solved.
video continuation to come.
Bear's declining wedge brings up another point
We know that the C-wave of a wave 2 can be an ending diagonal triangle (EDT) and that the same applies for 5th waves. We also know that B waves cannot end in an EDT. Am I right so far?
But, what about wave 4? .... wave 4s are generally triangles in their entirety, sometimes zigzags or flats, but ..........
can the wave-C part of a wave 4 end in an EDT?
But, what about wave 4? .... wave 4s are generally triangles in their entirety, sometimes zigzags or flats, but ..........
can the wave-C part of a wave 4 end in an EDT?
Thanks Bear, good stuff.
Pour on the coal, Bear -- I've always liked your stuff, even at the graveyard. Good point with the count you've shown.
Yeah, things are certainly looking up at this little corner of the virtual world.
Thanks brother.
Yeah, things are certainly looking up at this little corner of the virtual world.
Thanks brother.
Subscribe to:
Posts (Atom)