Joseph,
You start having me explain the use of trading tools and you will make the Bear sound much smarter than He is. The Best place I know to go for info on Pitchforks is Mr. Tim Morge, check out Medianline.com. He is imho one of the best in dealing with them forks.
Must say. He is in the middle of transferring his website to a different server, so some of the extras on his website may not be assessable, but all this should be completed soon, and there you can join a forum that discusses Pitchforks in detail. There are in addition, archives of Tim’s own posts on trade setups. It’s very good and well worth the time to study.
To me, the use of pitchforks, asserts the assumption that future price direction is in relation to the past, this idea in itself has caused much heated debates and a few small armed conflicts…..
Pitchforks basically mark the angle of future price from 3 different consecutive reversal points and define it by the use of a central (median) line and a set of equidistant upper and lower parallel lines. Statistics show that price (from the 3rd or last reversal point) will make the median 80% of the time.
As for me personally the only real help I can give is to use reversal points of the same degree. Others like to see a pitchfork define price activity before validating a setup. I like to use the forks in combination with EW to find reversal points for the next wave.
How to use them is a matter of personal preference, like most good tools there are several different techniques or styles that can be employed dependent upon the traders personality (aggressive or reactive) I will leave you to your own study, but some basics are as follows.
More to come……
Saturday, February 18, 2006
Myth busting: #1 Fed Funds Rate
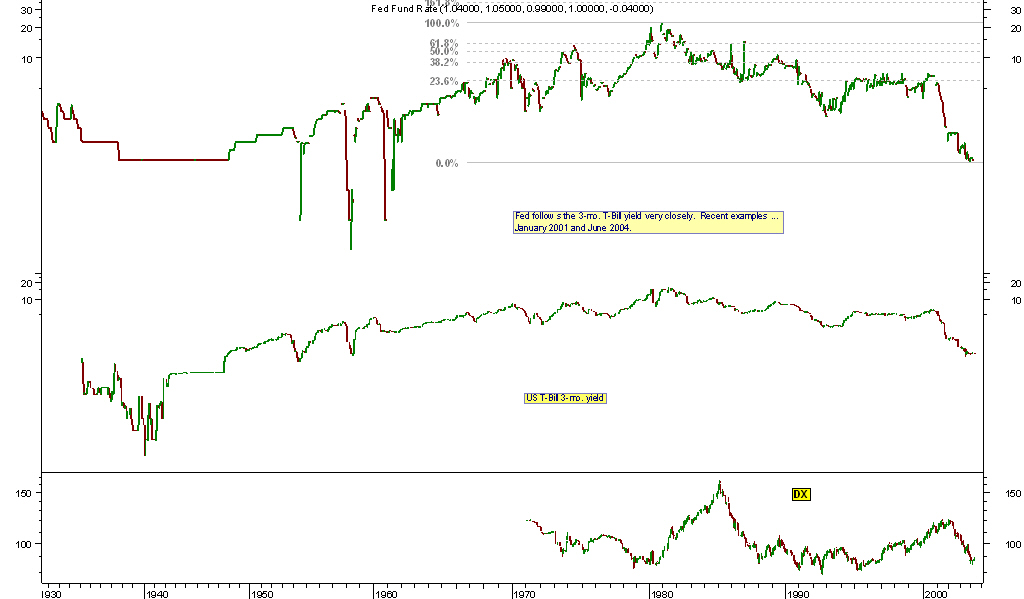
The Fed does not call the shots -- the 3-month Treaury Bill does and it does so bigtime. Most recent examples are the wave of Fed Funds rate cuts that started in 2001 and then more recently, the hikes starting in June 2004.
See accompanying chart. It is not yet updated -- looking for a good source for updateable daily/weekly raw data. Currently shows only upto March 2004, but it starts from 1930, hehehehe.
Get a fundamental analyst laid and you've converted him into a technical one -- thus a level playing field; then conversation can begin.
All the hoopla about how the FED will stop raising rates is nothing more than the technical congestion around the 5.0% mark on the chart hitting these fatcats with a dose of Nitrous Oxide -- the first axis of resistance is readily seen at Fib 23.6 @ approx. 6.0%.
That's what technical resistances do to fundamental anal-ysts -- vast quantities of effluvium and effluent discharge from them into the psyche of innocent bystanders.
First major resistance @ 9.0% approximately.
The quest for the Philosopher's Stone continues, albeit alone but with pride, pleasure and considerable dignity.
"If you get people asking the wrong questions, you don't have to worry about the answers!"
Series: Myth busting -- Fed Funds Rate, Easy Al & DX
We scored many waterpolo goals together, but what I remember best is what he (a master of the elbow angled flingshot into the corner -- all net) said to me in a Thermodynamics exam in engineering school:
"Physics, Chemistry, me don't like, but Mathematics, you write sigma, sigma and you get marks"
That's the kind of simplicity I like.
Enter Alan Greenspan, hundreds of million-dollar per year fatcat fundamental anal-ysts, CNBC and other talking heads and you have a recipe for disaster, ruin and bankruptcy -- only if you listen to them and do what they suggest.
Don't like any of the others, but I'm partial to Easy Al.
In the everlasting, perennial quest for insight into where the venerable US Dollar Index (henceforth just simply DX or DXY) is headed, we've had to endure reams and reams of gobbledegook -- time consuming, tiring and mostly just plain wrong.
If I'm going to go broke, I'd rather do it listening to myself than to these cats.
This is a work in progress -- stay tuned! :)))
See next post.
For Bear -- your daily chart with Andrew's Pitchfork?
I've overcome my initial culture shock reading your charts -- a combination of your own advice (eat your honey! :) .... ) and a stiff dose of strong Sake .....
Interesting indicator -- I've seen it used by one of the pros @ Elliottwave International with reference to the Nikkei's bear market.
Metastock's help file gives me the basics of how to draw it, but some questions definitely come up w.r.t usage:
When and under what circumstances would you bring out this weapon?
On your daily chart of EurUsd, there appears to be a likely location for point B, i.e. the 3rd point of the pitchfork.
Would appreciate some usage hints -- some tips/tricks etc.
Much obliged
Joseph
Six secrets ... from Mr. Wave 3, Lord Prechter!
If you don't know who this gentleman is, I'll tell you -- a recondite TA writer, intransigent in his stance for Deflation and its concomitant stock market crash, he is the Elliottwave guru I salute for my lack of skills, hehehe.
Unfortunately he is not adept in the art of consummating a marriage.
What do I mean?
Well, since October 2002, he and Miss Dow Jones, despite their passion for each other, have left us in perennial suspense as to the outcome of their union, with a stalemate as each stands on either side of the matrimonial bed, gazing lovingly at each other:
Miss Dow: I offer you my honor.
Mr. Prechter: I honor your offer!
This has been repeated, back and forth for 3+ years and neither has made a move yet.
What a waste! :))
------------------------------------
Here then are 6 secrets from him:
What Every Trader Needs To Be Successful:
No. 1 A method. Any time you enter or exit a market, it must be for a predetermined reason that will also apply in the future.
No. 2 Discipline to follow the method. Without discipline, you really have no method in the first place.
3. Experience. The School of Hard Knocks is the only school that will teach you the emotional aspects of investing, and the tuition is expensive.
No. 4 Acceptance of responsibility. Don't blame the news, "insiders," "floor traders," or "THEM" for your losses. Accept responsibility, and you will retain control of your ultimate success to the extent that the market allows.
No. 5 Accommodation of losses. The perfect trading system does not exist, so your method must deal with taking losses.
No. 6 Acceptance of huge gains. When the big winner finally comes along, you need the self-esteem and confidence in your method to take all that it promises.
Friday, February 17, 2006
Parting is such sweet sorrow.

Well looks like price is trying to pull away from the channel, but alas couldn’t bring itself to say good bye, it’s had such a good time the past several days that it wanted to stay the weekend, and a long weekend to boot. Given that Monday is a holiday.
Sooooooooo……..
Stay the course, expect to see a bit of a pull back to start the week then price to penetrate the channel, fall back retest the line then all points north. Would be advisable to cover a small portion to pay for this weekends honey and will try to hang on and look to add to our northward train next week.
Will try to take a look at some other pairs this weekend, but have to go check out baby bear, something about his chair being broken…..
Wishing all a great weekend
Stay alert! -- the assault could occur anytime!
For EurUsd aficionados, you will note that a 4-hr close above 1.1931 is not the only requirement -- she must also take out the overhead Fib Ext @ 1.1934.
GbpUsd must close > 1.7458
Don't neglect to closely watch UsdChf for she is very closely related to DX -- in some unfathomable, convoluted manner, her puny 4.1% part of DX notwithstanding.
Bottomline: the mini-attack is on; but will it escalate beyond the battalion @ the Fib ext.?
I don't know the answers to these deep questions -- my name is Joseph, not Abraham! :))
EurUsd .. take 2 ... looking right into his soul!
A tramp picks up cigarette butts from the street -- for every 8 butts he finds, its as good as smoking one full cigarette.
If he finds 49 butts, how many cigarettes can he smoke?
EurUsd .. my take 1 ..

Even my best friends don't know that my job is "turning Lead into Gold!"
:))) :)))
Hummmmmmm.......??????

Just something to make you go hummmm…….
Does the past hold a key to the future?
:)
Bear
Eur Weekly View

One of the things I like to look for is what I call cut thru trend lines, basic support/resistance lines that have been tested but with more of a diagonal path than traditional horizontal approach.
These imo offer good trade setups when price intersects them, specially when other TA tools are in conjunction.
Until this view breaks down, this is the game plan for the next several months.
bear
Eur Update
An update to the previous post,
Was having technical difficulties this morning trying to post, the Blog is all new to the bear and with big claws n’ paws it’s hard to operate a keyboard.
A special thanks to Stojce for helping me out.
Here’s the pic I was trying to post with current prices and the sliding parallel that was referenced.
So far price has held, If this view is valid the line should hold, the timing marks are still within a few days, so we could possibly hover around this area till early next week before any noticeable upward movement.
Any real breach of this area, and I have to go back to the drawing board.
Weekly view coming up,
Bear
Thursday, February 16, 2006
Market Update
I know. SMART and SMALL TRADER put together could be considered an Oxymoron.
No I don't have another Animal Planet Blog and mistakenly posted here.
I can't help that at few occasions while thinking on Market and Trading, picture of a Rhino and that little bird on his back came in front of my eyes.
Thousands of tiny little creatures are attacking the Rhino, but this little bird does not. It recognizes the size and the strength of the rhino, and it's own insignificance. So this smart small little bird feeds on and of his back. Rhino attracts thousands of tiny little creatures, lured with the idea that they've found their dinner, and they become a dinner.
USDX
as on previous chart, could finish little above the current high 91 around 92<>92.5, but could be probably finished. As noted in the two scenarios in prev post, and as bear posted, this kind of a situation is for those preferring low risk to reward trades, or top/bottom pickers.
It is a possible first down of a larger down, or a 2nd down of larger Up.
But you should always mind where exactly do you think the target is, so you could calculate the R/R.
CRUDE
Overshot my target zone 60.3<>59.15 made a low 57.35 which is almost right on the upper line of the target zone (57.10 to 43.9) for this correction from the August top.
It has a excellent finished 1-2-3 structure and could be in a wave 4 (target 59 to 60 to no higher than 62.5 - before a final drop in wave 5.
Or it could be a finished ZZ first wave W of a larger DZ, in which case this second wave X could correct to 62<>67 before a drop to 50 targets (detail in other posts), which is my preferred scenario.
EUR, GBP
I believe we have a minor top in place and that the generally we are in a continuation down to 1.15/14 in EUR and 1.69/68 in GBP (probably even lower)
Intraday, we could see this drop finishing little lower, just below 1.18<>1.17 in EUR, after it corrects to 1.1940/46. GBP could stay above recent low in GBP and correct to around 1.74<>1.76 (7433 and 7545) before it continues down to mentioned prices.
CAD
Not very clear, but up to 1.167 and possibly up to 1.2
Longer term down to below 1.00
JPY
I expect to stay below 119.37
Possible intraday up, but below 119.37 top
Below 117.2 down to min 115.3 but most probably down to 113<>107 (111.6 to 110.7)
NZD
Sorry Joseph, I haven't forgot abut longer term view of NZD, but now only the very short term.
possible small correction to .671<>.675 then down to .664<>.66
I'll do better when I get the Longer term Picture first.
A Smart Small Trader, a rare Bird.
 Why do some birds hang out on the backs of rhinos?
The birds – called Oxpeckers – are there for the food. Oxpeckers pick blood-sucking ticks and other parasites off the rhinos.
The relationship between the oxpecker and the rhinoceros is an example of "mutualism", a relationship in which both organisms benefit. In other words, it's a win/win situation – the rhinos get rid of unwanted pests and the birds get a tasty meal.
EurUsd on 4-hr ... he ain't 57.6% of DX for no reason!
EurUsd also @ 161.8% of my voodoo Fib grid.
A 4-hr close above 1.1931 will be hammered fervently.
caveat: the FE 161.8% @ 1.1772 is acting like a magnet.
I'm in lightly.

Short comment on this Blog technicals...
For now resident here are Joseph, Bear and my self, all responsible for the rumbling, and Stojce who is helping with his programing.
If you have any ideas, questions, requests, concerning the Blog technicals, MT4 programing and other possible web issues please contact Stojce.
He is the one that set up this blog, providing nice environment and working on few interesting improvements for the near future. For free of course.
So mind that when asking, he is willing to help but he has his own daily responsibilities too :)
I appreciate his help greatly, and his the one I was working with in developing some indicators for MT4.
ID
Start of C?
A short term change in direction maybe at hand, very low risk to reward.
This view is at the failure point. Price is at the bottom sliding parallel of the fork and has for the moment found support. Looking to long back into 11850 on a retest of current lows.
With some very basic fibonacci timing marks from various points of the pitchfork points we are close to a time for change.
Just an amateur bearish thought.
bear(this is the first time to try and post a chart, so we will see if this works)
Market Direction - Forex
Bear's Thoughts
Who knows the enigma that lurks in the minds of Bears…. Only the Shadow. ( evil laugh in the background )
To answer Charlie's question.
The bear is a reversal trader, the proverbial top and bottom picker. Strictly a technical trader, I don’t get caught up in the news, figure the people in the know, already know, and they ain’t telling except it’s shown in the charts.
I use a combination of:
Not necessarily in this order,
(a) Elliott wave on all time frames, starting with the weekly, daily and working down
(b) Andrews Pitchforks
(c ) Fibonacci levels in conjunction with chart patterns
(d) A plethora of Gann, Jenkins and Gilmore techniques.
I prefer to trade complete waves trying to get it to where I’m trading on 3 different time frames. What would be positional trades, lasting for weeks “preferably carry“, swing trades 2 to several days and then intra-day. Some of these will be in opposition to each other.
I use Elliott waves as the backdrop for direction, wave counting. I’ll employ an arsenal of geometric studies at the prior waves, in hopes of them releasing their secrets as to the time and place of the next waves inception.
In Theory……
Sometimes its easier said than done. But I prefer to reversal trade as it gives me the best risk to reward ratios for entries, I’ll be either right or wrong quickly, trying to cover my trade expenses in an effort to get my trade in a “free ride” status and then try to hang on till the next one!
Please be aware that the Bear is very much a student of the markets. And am in the process of molding my trade techniques to employ the longer, positional trades.
A work in progress…….
But I will warn everyone, my charts sometimes look like a New Jersey road map.
Sorry Joseph.
Bear
Charlies suggestion set in motion ....
Here's what he said,
"One thing that I would appreciate is an overview of the approach that each contributer takes. Your analysis is based on EW, but Trader One & Bear Profits take a slightly different tack. The different approaches will be the strength of the site, but a few words explaining them would be very helpful for the reader".
OK then, here's mine:
Simplicity is the key:
Technical:
(1) Fibonacci levels (S&R + targeting)
(2) Dow Theory -- simple mechanics of TREND.
(3) Trendlines, especially angles of attack.
(4) Commonsense.
(5) One or 2 indicators that are used in unconventional ways
(6) EW only on "monthly/weekly" timeframe -- intraday use can be puerile, futile and fatal & sometimes downright assinine, hovine and bovine!
Fundamental:
In the antediluvian quest for higher YIELDs, where is the herd likely to stampede to & ..... when .... and how passionately (sentiment)?
This is the only factor that matters in the vast sea of torrents of nonsense.
Yeah, I read all kinds of articles, but for me, "Opinions are like ass*oles; everyone has one!"
The cleanliness, unclutteredness and ample white-spaceness of one's chart is directly proportional to serendipitous, untrammeled profits, hehehehe.
More on "follow the money trail" to determine which currency to be in for the long haul -- in future posts.
I'm relieved to be in a place where the long haul is what it is and not just 2 days, as it appears to be -- at MoneyTec. :) :)
Detail from prev Chart

USDX EW scenarios
Previous chart with running Flat is one possible scenario indicating AB finished, C possibly in progress (with red line indicating A, and light blue lines indicating a and c of a B) or one more leg down to finish c of B (darker blue in the Flat detail)
On this chart you can see two similar scenarios. At the moment it is the best I can do. Not really clear and it is due to the fact that I had a small pause, I was not following news and it is important to me since I don't look only in the geometry of waves, but I'm trying to grasp whats beneath.
The sentiment is still very USD bullish, "fundamentals" are not.
With Crude falling in a free fall, and signs of slowing in the economy, especially housing, for which I wrote in September last year that is a major contributor of the GDP, more tightening could be hardly justified, but is not impossible to happen.
here is the chart :)
ID
will be back with comment on NZD chart.
Wednesday, February 15, 2006
DX daily chart with EW -- ID, your thoughts?

ID, sock it to me; you won't hurt my feelings; when I called a couple Crude Oil tops, even my dad stopped talking to me. I'm used to it, hehehehehe.
My take:
From December 31st 2004 bottom DX is in wave (A) up.
Waves A and B of (A) completed very early as shown.
Wave C of (A) started March 11 and is still in force.
Currently should start wave c of (iv) down.
Then (v) up to complete wave (A).
The drop to the confluence of 2 Fibs, one a genuine descendent of Fibonacci, the other a voodoo concoction, is also close to the trendline shown -- no violation of encroachment into wave (i) territory.
I thought my life was going to be easier after leaving MoneyTec, but this EW is like working for the FBI .....
Regards
NZDUSD long-term chart for ID (if necessary) -- for EW.

I've erased my EW labels as I really am not at all confident of the count.
I'll leave that to you ID.
With the 7.5% current Libor rate for NZD, it is clear why I'm interested in this currency.
Pairing with CHF is being looked into (with JPY too), but it offers a nice enough differential even when paired with USD. If DX weakens, this could be sweet for (LONG) NZDUSD
Regards
NZDUSD
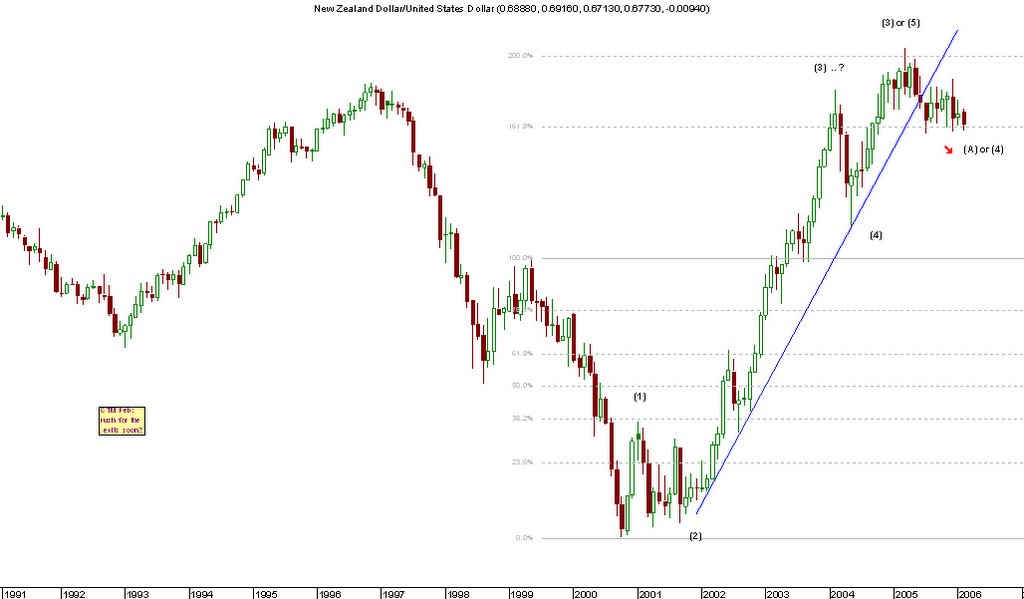
Attached is NZDUSD monthly -- please help the long-term (only) count. Are
we in (4) down?
Would appreciate your rationale.
Thanks
Joseph
Update 15 Feb
CAD
Thank you Anonymous, :)
Yes, that spike during the news was a nasty one, always too risky to trade before news, and it completely swiped my previous CAD post, so it doesn't even matter that after the dust came down, CAD made to 1.1511
Intraday support little above the recent low at 1.1511 and below that 1.1490/85 to retest 1.1374 low and possibly continue below.
Above 1.1568/73 resistance at 1.1660/1750 to 1.2000/2020
Crude made to the first target (closed right above the fib line and important MA on wkly) and I expect a correction to 64.30<>65.50 before it continues down to somewhere around 50 (54-47 or 44-32)
USDX Critical support around 90.35 and 90
JPY
I am confident it will stay below 117.69/85 but certainly below 118
Strong support between 117.30 and 116.87 break below that support area will confirm 115.45/06 to continue down to 111.6 to 110.7
AUD
Not really an opportunity there yet.
Probably down to 0.7395/89 then up to 0.7427/35 .
Gold quite possibly in a correction up to 556.7/557.7 to continue down to around 510.
This could indicate possible AUD move up above the mentioned resistance to test 0.7510/77/98 and possibly 0.7697
Below, support @ .7389 for a .7232 to .6773
Crude and Gold, and partly USDX, all support weaker dollar on very short term at least.
it is quite late, continuation in the morning
ID
Tuesday, February 14, 2006
CAD intraday
Could be a nice setup in CAD (just a glimpse)
most probable direction intraday id down to min 1.1510. Below that is safe play.
Above 1.1576 up to 1.1664 to 1.1756
Be back in few hours for more detail, just wanted to bring this to your attention.
ID
most probable direction intraday id down to min 1.1510. Below that is safe play.
Above 1.1576 up to 1.1664 to 1.1756
Be back in few hours for more detail, just wanted to bring this to your attention.
ID
USDX update

A possible development I was considering on EURUSD too.
The fact the that possibly finished C, ended equally in a cent of previous decline wave A,
could confirm Once Upon a Time in the West scenario, which teaches to never turn a back on a dangerous guy, even if he showed up on a gunfight only with a knife.
If 90.35 and 90.10 provide solid support, we can expect USDX to continue for a final rally before a larger degree move south.
However, looking on a Daily and weekly, a possible min correction down from here could be around 89.50/55 for a retest and continuation below 87.83, before a final continuation up.
Let's see how this unfolds.
On the picture is what could be a Running Flat (light blue) and the other part (darker blue) is what could follow if this is not a finished Running Flat.
ID
This is piratically the second day in the new home, we are still moving in, so please have a little patience. We need to accommodate to this new media. I was just told that this is practically a web site and we can add pages with lots of useful content, so if you have any suggestions what could be useful just write. I have few crazy ideas my self, but for now let's stick with simple blogging. I'll let Stojce surprise us with some more useful and handy stuff.
ID
GBP

A thought on GBP for Joseph (Trader01) as he was looking for a time of movement in the pair. Everyone has their own trading preferences that are unique to the individual, as for myself (mainly because of gracious tutoring and the fact that it makes sense in my Bear Brains) I look for a time for change as well as price.Shown is a point in time, figured from the cross angles of the pitchfork, for the pound to react. Although I like the current low and would respect it as long as it holds, my thoughts on equal or measured moves are shown in the event of the low being breached.This is more of an if then setup, Long, if the channel holds and if price is in the box at the appointed time ( choosing from various fib and trend line levels that would be determined then).
Bear
EUR - by Bear
 Here is message I've just received from Bear:
Thought I’d send my daily on the euro, guess it all depends on how you view the top back at the start of “05”. Having a few different thoughts from the start of the year where I was placing that 5 on the 1640 low.Thinking that area is now the end of the 3rd and we are now turning north on C to finish out 4.As long as the bottom tine on the pitchfork holds, 11850ish, think this view is still valid below this opens the door for a retest of the 11640 area and the bottom of the channel them 11300’s and low 11400’s mentioned at the end of last year.Something like this……Like the Blog, keep up the good work and send my regards to Trader01 and the gang.
____________
Tnx Bear, and I wait for your approval to add you in the members list so you can contribute to the benefit of all readers.
Monday, February 13, 2006
Maintenance ongoing
Hi guys
You may experience some strange phenomenas around, things appearing and disappearing, but don't worry, it is just I'm shaping this site to make it better.
We plan adding few other useful pages if we manage to solve the file hosting problems (tools download page and things like that)
Hope you will like it.
Stojce
USDX
And right on the 61.8 fib @ 90.79 (current daily bar high 90.78) form the Nov 16 @ 92.63 to Jan 24 low @ 87.81 sugesting at least a correction down to around 90.35/25 to 89.55
Pay attention to JPY. I have a strong confidence it is going down to 110.7
ID
DX in action; a blast from 2006-2007 between 96 & 100.

The final showdown:
On the far side the lone gunfighter is my friend, DX. Facing him are the 3 gunfighters sent by Euro -- AUD, CAD & GBP. Behind to the far right are the 3 horses they rode to the station.
DX arrivedby train, getting off on the far side of the platform.
He wears no gunbelt, but unbeknownst to the others, there is a gun in the handle of his duffelbag -- within easy reach.
Here's how the last words of CAD are to go down in history:
DX: Did you bring a horse for me?
CAD: (Laughing derisively) No, looks like we're shy one horse. (GBP and AUD laugh and chuckle, showing nothing but hatred and disdain for the lone gunfighter).
DX: (shaking his head, holding their gaze firmly, relaxed and expressionless) No, you've brought two, too many!
CAD, AUD & GBP: (The laughter stops, as fear and consternation grip them -- they were thinking; how can he be so confident when he has no gun? ... especially when he was foolish enough to come alone?)
The draw starts -- results will be revealed @ DX = 96 or 100 in 2006-2007.

GBPUSD good odds for entry on 4-hr soon

GBPUSD 4-hr entry close at hand for (?) days hold. Current price 1.7389 @ Alpari Feb 13th, 2005, 12:00 bar.
Shortly on USDX
Just shortly on USDX since I've screen it. Charts tomorrow.
Now the drop from Nov 16 has a finished ZZ structure and now the question is if it is a possible XX so we can see a continuation above the high, or is (A) or (W) of a possible Flat or DZ (Double ZigZag).
If it is a part of a Flat, than the move up from recent low (87.83) could qualify for a developing ZZ with A finished IM and possibly B finished so C in progress for a retest of a high for a nice (B) of a Flat, or
if it is a part of a DZ, then this recent move up could qualify for an (X) of a possible DZ down, so we can expect the next move to be a ZZ down (which has internal structure of 5-3-5 or IM - any 3w - IM)
In general, and I'll try writing more on this, I think 2006 could turn into an endless range trading, although as I wrote few times before on MTec, there are some serious structural weaknesses in US economy and society that could trigger some serious shifts in the "mood". I don't expect it to happen soon, but I would not rule it out neither even that it seems that the US bull is still raging.
ID
GBP Intraday
GBP risky
Well it is either me, or market should clear a bit, but I really don't have a quite clear picture on the development right now, same as other pairs I've already published except JPY.
Below 1.7347 should min retest 1.7074
It looks like in a 4th of an IM move down, and in such case, it will have to stay below w1 low @ 1.7634
Above that, Resistance around 1.7540 and above that to 1.7680/7700 to 1.7850/8094
Possible longer term downside targets are 1.6820 to 1.6410
ID
AUD Intraday
AUD looks like it has to go just little more down to 0.7347 but below that will open down to 0.6638
However it is possible that it will bounce up from 0.7347 and in such case resistance can be seen at 0.7440/50/87 and 0.7510/65 toward 0.8
ID
However it is possible that it will bounce up from 0.7347 and in such case resistance can be seen at 0.7440/50/87 and 0.7510/65 toward 0.8
ID
CAD Intraday
CAD will have to stay below 1.1562 to confirm continuation down
Above that price level needs to break above 1.1576/80 to extend to 1.1679/88 to 1.1745/60
Pretty fuzzy picture however. If you look down there are to many first of a first of a... on the up side too many running Bs. Will wait for some more clues to unveil.
Most probable direction intraday is down to 1.1511 to 1.1497 second being more probable in such case.
Longer term outlook is still still very CAD bullish, at least I'm bullish on both Canadian Dollar as well as on some CAD stocks.
In fact on the Central Banks monetary policy dovish/hawkish scale, I expect this year CAD to be on the upper hawkish scale above EU and US. And since I'm on that subject, I expect BoJ (JPY) to flip on the Hawkish side this year, and BoE (GBP) to stay on the Dovish side.
More on rates later this week.
ID
Sunday, February 12, 2006
JPY Intraday
And here it is, the first analysis in this new Market Direction.
I wish to thank my dear friend Joseph you know him better as Trader01, for accepting my invitation to contribute to this Blog, and I hope many of you will join us too.
Now let's make this short and get to business, market started to move.
I'll start with USDJPY
Later I will return to the longer term chart to see the possibilities there, but for now just a brief Intraday to short term.
I expect continuation down to 111<>110.7 and below.
I see the latest downward development as a possible IM move with 1-2 finished i of 3 finished with ii of 3 possibly finished or in progress and to finish around 118.18/42 but should not finish above 118.93. Above that we will have a probable retest of the 121.38 high and above.
Break below 117.32/23 would be a first signal of a possible continuation down, but only a break below wave i of 3 low @ 116.87 will confirm. Targets down on confirmation 115.44/115/111.58/110.61
If on the other hand we have a Unfinished ZZ up from 113.41 12 Jan 2006 low, then we have an A-B finished with C just started from the recent 116.87 low. Min target for this C could be 61.8% extension of wave A @ 120.56 and next is the 121.38 High.
ID
CAD, AUD and GBP to follow shortly, since the market is moving I will post as I write. Later USDX and EUR, possibly EURJPY since I've noticed a nice settup there, GBPJPY and NZDUSD
My areas of contribution
May this venture flourish and prosper, stay its course resolutely, encourage thought and may the participants acquire the ultimate market gift -- prescience!
The engine: US Dollar Index on 4-hr., daily, weekly and monthly timeframes.
Crude Oil, Spot Gold, CRB Index, Fed Funds Rate, 3-month Libor Rates & International Bond Yield Differentials.
The Driver: USD -- EUR -- YEN .... which will dominate for the current cycle?
For this cycle:
The structural frame: EURUSD
Driver's seat: USDJPY, USDCHF, GBPUSD
Passenger seats: USDCAD, NZDUSD, AUDUSD, USDTHB
Trunk: USDBRL, USDMXN, USDINR
Subscribe to:
Posts (Atom)