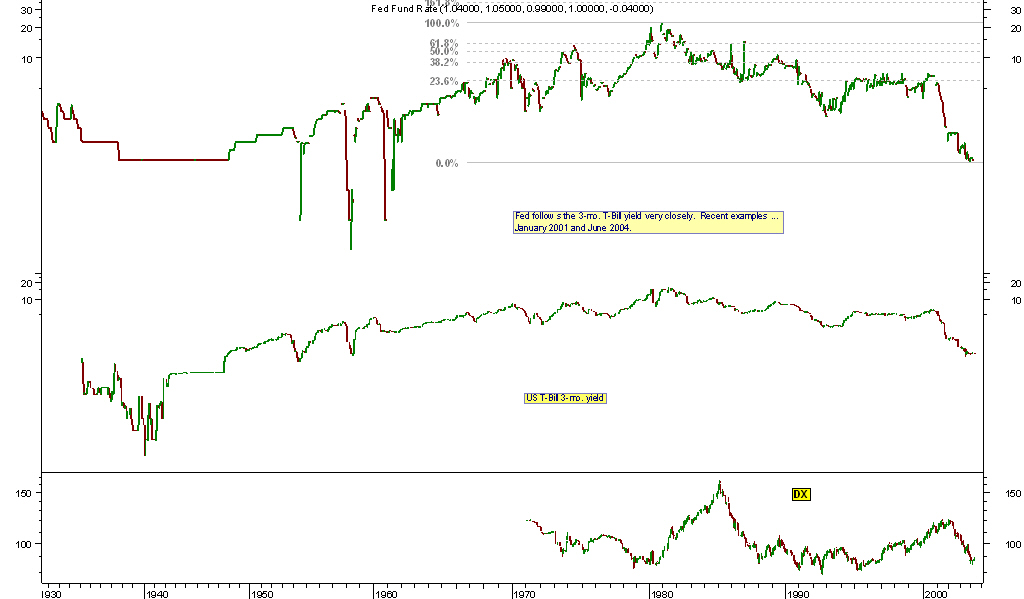
The Fed does not call the shots -- the 3-month Treaury Bill does and it does so bigtime. Most recent examples are the wave of Fed Funds rate cuts that started in 2001 and then more recently, the hikes starting in June 2004.
See accompanying chart. It is not yet updated -- looking for a good source for updateable daily/weekly raw data. Currently shows only upto March 2004, but it starts from 1930, hehehehe.
Get a fundamental analyst laid and you've converted him into a technical one -- thus a level playing field; then conversation can begin.
All the hoopla about how the FED will stop raising rates is nothing more than the technical congestion around the 5.0% mark on the chart hitting these fatcats with a dose of Nitrous Oxide -- the first axis of resistance is readily seen at Fib 23.6 @ approx. 6.0%.
That's what technical resistances do to fundamental anal-ysts -- vast quantities of effluvium and effluent discharge from them into the psyche of innocent bystanders.
First major resistance @ 9.0% approximately.
The quest for the Philosopher's Stone continues, albeit alone but with pride, pleasure and considerable dignity.
"If you get people asking the wrong questions, you don't have to worry about the answers!"
No comments:
Post a Comment