Saturday, March 04, 2006

I'm fine, Dow you doing?


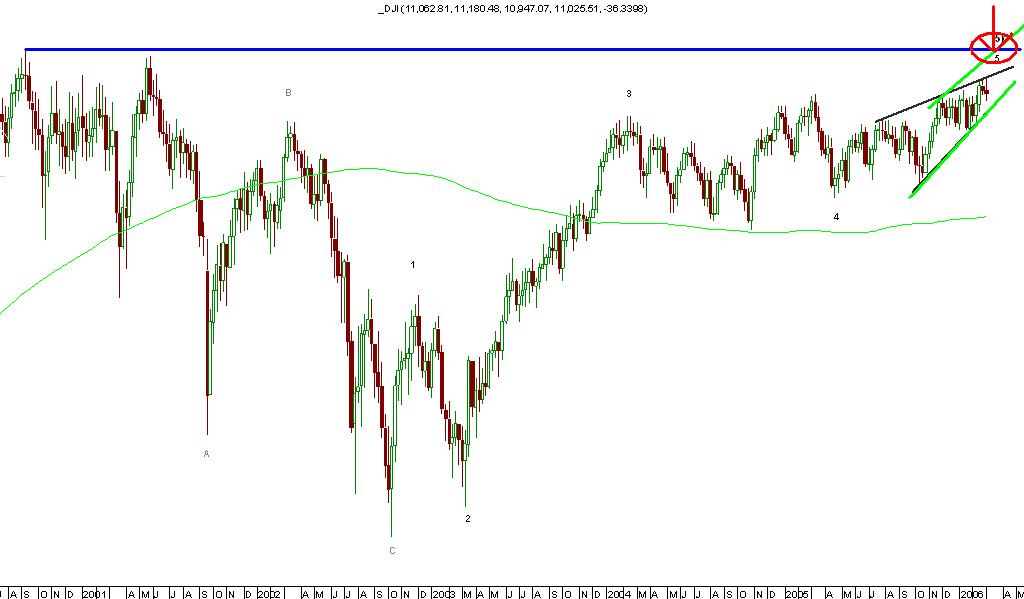
Here's the spot to hang-ten on an "A" wave

USDSGD: here's my EW count


I can see the entire island in under 2 hrs but I'll be damned if I can figure out the count with any degree of confidence!

ID: Need reinforcements; I'm outnumbered & outflanked!


I need your help, buddy. The count for USDTHB

USDTHB: Oanda has the data for the Father, the Son and the Holy Ghost -- i.e. Japanese Yen, Singapore dollar and Thai Baht -- all versus USD. Their relationship to each other w.r.t. USD is unmistakeable and their tight bond is in line with regional relationships in the stock market indexes too. Since early September 2005, the Baht's tight correlation suddenly derailed.


I've done well for 4 years knowing when to switch between one and the other (USD or THB) in a non-currency trading sense; but now, since I am a currency trader and live in SE Asia, the importance of this pair in my life has exponentialized.

There is not even one good, reliable conventional Tech. analyst (EW analysts? .. forget it!) in the region, so for years I've gone the Thai Stockmarket totally alone, generally against the entire stock analysts calls and have been winning, but I've come to a crossroads and I'm lost with regard to this pair since September.

This is the reason why I therefore stayed out of the Thai stockmarket since then -- I've lost out on stock gains by not playing, but due to the fact that the Baht is 90%+ positively correlated to the stock market, I felt that my uncertainty on the Baht justified my not entering the stock market.

OK then -- see monthly & weekly charts. If necessary I can shoot off the Metastock format to you -- data goes back to 1984 for USDTHB and to 1991 for USDSGD.

As for USDJPY, we have already discussed that before, so need to take it up again except as a reference, if necessary.

I do realize and know quite well that EW analysis insists on studying a market for itself, regardless of relationships to other markets, but I brought up the 2 other pairs solely for reference and background in the event it might help put some perspective on my dilemma.

Regards

Joseph


Dow Jones: One more shot at 11,200?


A fundamental analyst was on his way to the airport; suddenly, upon seeing a signpost, he became extremely disappointed and made a U-turn, muttering under his breath and headed back home.

Why?

Because the signpost said, "Airport left"

Friday, March 03, 2006

Interest rates

Einstein dies and goes to heaven only to be informed that his room is not yet ready.

"I hope you will not mind waiting in a dormitory. We are very sorry, but it's the best we can do and you will have to share the room with others" he is told by the doorman.

Einstein says that this is no problem at all and that there is no need to make such a great fuss. So the doorman leads him to the dorm. They enter and Albert is introduced to all of the present inhabitants.

"See, Here is your first room mate. He has an IQ of 180!" "Why that's wonderful!" Says Albert. "We can discuss mathematics!"

"And here is your second room mate. His IQ is 150!" "Why that's wonderful!" Says Albert. "We can discuss physics!"

"And here is your third room mate. His IQ is 100!""That Wonderful! We can discuss the latest plays at the theater!"

Just then another man moves out to capture Albert's hand and shake it. "I'm your last room mate and I'm sorry, but my IQ is only 80.

"Albert smiles back at him and says, "So, where do you think interest rates are headed?"

EurUsd: A pair if one dies? A view to a kill; 2006-07


The Draw:

Euro: Nothing matters now - not the land, not the money, not the woman. I came here to see you. 'Cause I know that now, after all this time, you'll finally tell me what you're after.

Dollar: ... Only at the point of dyin'.

Euro: ... I know.


The draw begins and euro is shot thru' the heart, the bullet whipping his body 180 degrees -- he falls to the ground but he ain't dead yet.

Euro: Who are you?

Dollar: (takes off the harmonica hanging around his neck, walks up to the sprawled Euro and places it in his mouth. Euro's eyes start wandering as his mind flutters in an attempt to determine the significance of the harmonica -- then recognition arrives as he realizes he himself had placed this very same harmonica in the mouth of Dollar when he was down and out back in late 2004; a mere shadow of himself -- and with Bill Gates and Warren Buffet taunting and screaming insults at the downtrodden greenback.)

Just as long as the song doesn’t end up like this

I've seen the bright lights of Memphis And the Commodore Hotel And underneath a street lamp I met a Southern belle

Well, she took me to the river Where she cast a spell And in that Southern moonlight She sang this song so well

If you'll be my Dixie chicken I'll be your Tennessee lamb And we can walk together Down in Dixieland

Yeah well, we made all the hot spots My money flowed like wine And then that low-down Southern whiskey Began to fog my mind

And I don't remember church bells Or the money I put down On the white picket-fence and boardwalk Of the house at the edge of town

Oh, but boy do I remember The strain of her refrain And the nights we spent together And the way she called my name

If you'll be my Dixie chicken I'll be your Tennessee lamb And we can walk together Down in Dixieland

Yeah, well it's been a year since she ran away Guess that guitar player sure could play She always liked to sing along She's always handy with a song

Then one night in the lobby Of the Commodore Hotel I chanced to meet a bartender Who said he knew her well

And as he handed me a drink He began to hum a song And all the boys there at the bar Began to sing along

If you'll be my Dixie chicken I'll be your Tennessee lamb And we can walk together Down in Dixieland


Little Feat


Gonna throw out a intra-day bearish contrasting view, me thinking euro’s has seen the high for the week and is heading south towards the black median, if current high is taken out will look to short off a retest of the upper black tine 2085/2100. Looking at the moment for any retest back into the 2030-40ish area to short.


As for the Cad have put on a small long position and have scaled in from 1348 thru 1311 pyramiding my entries remainder of orders are sitting just under 1300, 1290 area.

Time will tell......

USDCAD: Defcon 4 alert ... oil weaponry & wait!


75% probability for ignition at contact point shown in daily chart. Caveat: 161.8 level is still a bit lower on voodoo Fib grid and is acting like a magnet/magnate. Macd has already made contact. RSi not yet. The trendline supports are from 2004 and 2003 respectively and command considerable respect. If they fire, it will be a rocket blast for some good gains, even if it is only for a few days.

More as we go

Go salowly.

Currency trading ... this comes to mind

She walks everday thru' the streets of New Orleans
She's innocent and young, from a family of means,
I've stood many times outside her window at night,
To struggle with my instinct in the pale moonlight,

How can I be this way when I pray to God above,
I must love what I destroy and destroy the thing I love?

........................................... Sting

My recent call -- result .... what's yet to come is gravy!


See chart:

First yellow ellipse: short closed and reversed to new LONG with low position size entry.

Second yellow: added another LONG, double the previous size, but still relatively small.

What happened then? My hL (shown with the blue check mark on chart) notation just below the 2nd ellipse was my take that we had a higher low. I was wrong as EurUsd rose but then dived to a new low. I was embarrassed and pain shot thru' my corpse with tantalizing accuracy.

What followed the final low makes me a proud newbie -- 2 heavy duty premature ejaculatory leverage plays were fired in quick succession, as you can see by the brown ellipses. As we approached the 200-pd MA on 4-hr (with the 200-pd on daily within slingshot reach) I withdrew the ejaculators and reduced them to just 1:1 as I wait for possible retrace or further breakout.

Whatever comes now is just gravy, of which I will partake heartily.

Is this the wave C up that I called the final charge upward to complete the Euro rally that started Nov 16th? Dunno, but I'm entitled to call it Joseph3 ... for now.

Therefore the entire 4-hr turn has been called and is now concluded!

There is much to learn still; it is clear that I was in early -- I don't like that and need to work on this some more. But I gots the time and the inclination to do this and do it well.

Other newbies -- it can be done, disregard the 90% loser propaganda that is so amply written about at the graveyard! Bah!

God, do I love it so!

Thursday, March 02, 2006

EurUsd: EW International's current take


ID has produced yet another masterpiece. Clearly laid out alternatives and excellent study material for a student. Much obliged.

Shocked to see ID's "despised" alternative coincide with my preferred call. I thought we was friends! :) :)

Presented is EWI's latest EurUsd take -- its on their website and is a free article; don't believe I'm violating any copyright laws, but if so, I'll straighten it out with them, if contacted.

Here's the article in its entirety:


What Moved EURUSD Today: Facts or Speculation?
2/28/2006 3:00:24 PM

Today (Tuesday, Feb. 28) was an especially interesting day to watch forex headlines. In the very early morning hours U.S. time, one major online news source ran a story saying that the dollar was “headed for its first monthly gain since November against the euro on speculation the Federal Reserve will keep raising interest rates.”

Oh, that proverbial “speculation” about the soon-to-be-here higher interest rates. Listen to that reasoning, and buying the U.S. dollar every day is a great idea. But oops – how ironic – just as that story was hitting the newswires, around 2:30 AM this morning the dollar started to fall, sending the EURUSD almost 100 pips higher by noon.

Seeing such “unexpected market action,” the headlines changed the tune later in the morning, blaming the EURUSD rally on two negative economic reports released at 10 AM: drops in consumer confidence and Chicago area manufacturing.

Of course, if you check the chronology, you’ll see that the USD started losing to the EUR almost eight hours before the Chicago PMI and consumer confidence numbers came out. In fact, by 10 AM this morning, the EURUSD rally was already half-way finished.

Still, forex reporters did get one fact straight today – the one about the currency markets being moved by speculation about facts, not necessarily by facts themselves. Speculation is all about hunches, feelings and emotions – in a word, about psychology. And few market analysis methods are as good at anticipating shifts in market psychology as Elliott wave.

To wit, here’s the forecast we published Monday night in anticipation of today’s EURUSD rally:


Update For: TuesdayPosted On: Mon, 27 Feb 2006 21:19:00 GMTEURUSD [Last Price]: 1.1849Confidence Level: Medium-High …the Minor wave A bottom is in place and that an irregular flat Minor wave B corrective rally is in its early stages.

Wednesday, March 01, 2006

EURUSD 2005 drop

Hi
I know I've posted my preferred views on EURUSD in few occasions on MoneyTec, and know I am posting kind off an update of that Charts.

Joseph, I started writing my analysis on JPY Longer Term, but would definitely like to try a recorded video or a MS NetMeeting conference. I have some problems with audio, hope to solve it quickly. If not I'll have to write it. I'll do NIKKEI and CAD together with JPY.

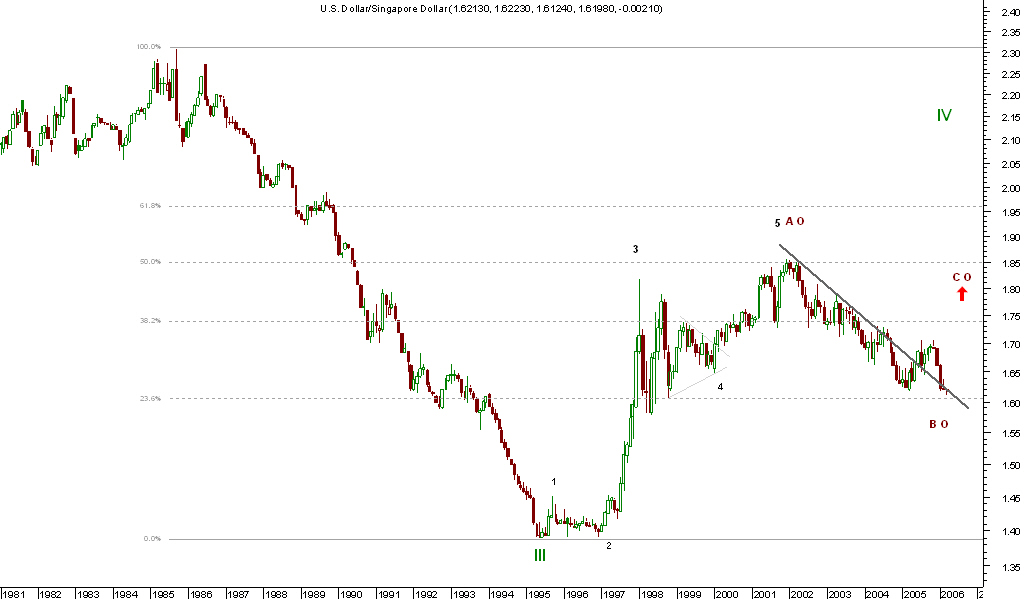
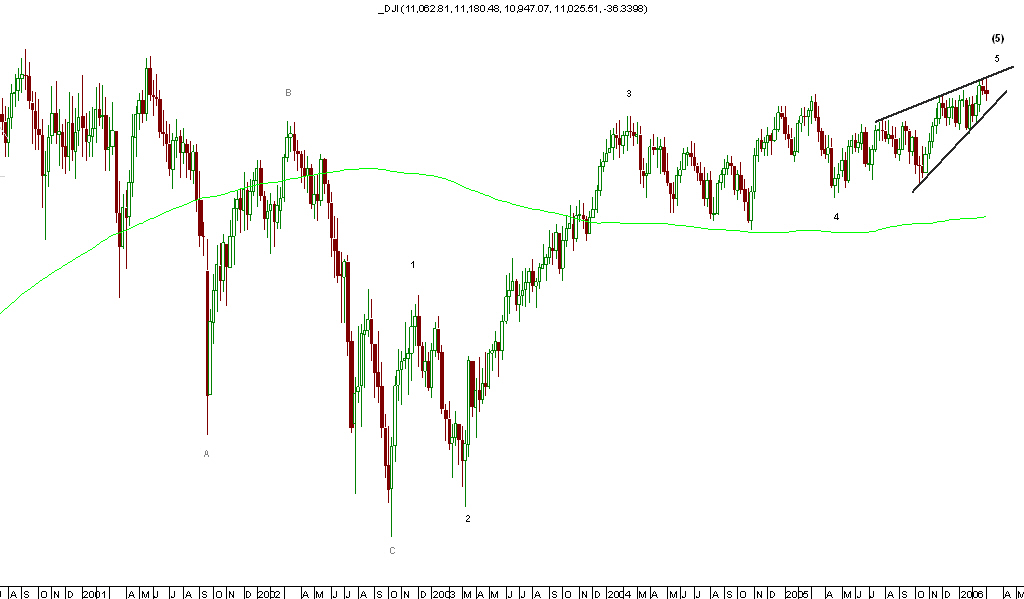
On the charts is the drop from beginning of 2005. Since I believe the chart is clear enough no need to explain it.


Second chart is the recent drop and how I see it.

As I wrote few posts back in those Market updates, I believe we are in a downtrend and I don't expect any surprises.


But there is a possibility of a correction to go to upper levels 1.2040 to 1.2160
On the chart up are the resistance levels, and above that could comletely change the view.
If USDX can't make it above 90.40/55 then we can expect it will drop further down, so possible larger gains in USD based pair.

For Bear : misunderstanding!

Bear,

Thank you for your explanation on the subject of assumed risk. Nicely stated.

However, I see you've misunderstood me quite a bit.

I was not looking to enter UsdJpy at the resistance level of 121 or even thereabouts. Such an entry, even one for a long-term play, would be foolhardy as the most probable route is south. Buying a top is the 2nd worst sin in my book.

Even before my post I had a gameplan wherein I would enter on the correction to the area between 108 and 116 -- not @ 121. This is still my plan regardless the longer-term view.

The question was not entry dependent, only directional dependent -- i.e. looong-term is UsdJpy heading to the upper reaches or to the basement. EW thoughts and other types of analysis, all welcome.

Hope this clears things up.

USDCAD: Some important points to consider.

I will enter only on breakout! If we do get to the 78.6% retracement level @ 1.1000, I will position. The 75% Long/Short ratio at Oanda suggests a short-term rally, but for a lasting bottom we've got to see a "flip" in positioning -- i.e. a sudden switch by the majority to a Net Short position. Then we might have a true bottom.

UsdCad is retracing the entire run from 1970 -- Jan 2002 and has crossed the 61.8% fib & is just shy of the 78.6 @ 1.1000. Core support, dating back to 1978 has slowed down this freight train some.

Lowest RSI weekly reading in June 2003 -- divergence galore; players banking on divergence alone can be found in low-cost hospitals all around the world.

I've swing traded this beauty very gently -- low leverage plays, profitable but not worthy of substantial merit.

She's got to retrace the drop from May 2005 sooner or later -- that will be a nice run. I shall partake of her bounty, but only on breakout!

ID, know any other establishment that puts out accurate Long/Short ratios, other than Oanda?

EurUsd: As straight as I can say it, friends or no friends!

EurUsd is declining in a large degree A-B-C pattern. Stated another way, the decline from December 31st, 2004 is NOT a 5-waver down!

Trying to put 5-waver labels on the run into 1640 will engender considerable difficulty later on.

It is best that one resolves these difficulties asap and has plenty of powder ready for the large degree wave C down, which is yet to come, perhaps later this year -- we are still a ways from this, but preparation is the ticket here.

Any which way you cut it, EurUsd ain't in a '5' down!

:) Peace brothers!

Nikkei: EW study continues .....


ID,

alternate: A large wave IV triangle that spans decades is the appropriate punishment for 200 years of bullishness, 2 world wars and millions killed in Asia. If I was calling the shots, I would have China gobble them up -- but there's always the possibility that Uncle George might just make them the next state. :)

OK, thanks -- the (a) (b) (c) longer leg view is now clear as to what you had previously meant.

Regarding your valid point about wave 3 being only 100% of wave 1, which would therefore bring Nikkei close to zero-- not impossible, but unlikely? .... see my take below ...

It soy-tenly can! Wave 3 can terminate a market at zero and bankrupt it regardless the Fibonacci ratio matching up at the point of death -- to see the full extent of the damage one would have to continue on into the afterlife to see the actual termination point, hehehehehe. :)

A country that has started 2 world wars, slaughtered millions in Asia, still predominantly bullish for the most part -- a country with the likes of Honda and Toyota still in raging bullmarkets -- after just 13+ years of correction of the whopper prior run, they're now in a new raging bullmarket?

If so then their bearmarket has been more like a picnic. :)

If everybody agreed on the count there'd be no fun -- ... said the englishman to the indian, "its very strange that you have so many clocks in your house -- all showing different times!" ..... replied the indian, "no, my friend, what would be idiotic would be to have so many clocks all showing the same time!"

USDJPY: An alternate count!


Still inviting analysis from others, but kindly be more specific as to your caveats etc. -- a chart showing your points is preferred.

We are still only talking about the long-term view -- let's not mix this up with trading views.

See the 2 yellow ellipses in the chart -- the first is a definite triangle, the second is also a possible triangle but I'm not yet convinced.

Presented are my 2 counts.

Action between 121 and 100 will certainly give me the clue as to whether UsdJpy will break the heavy resistance @ 121 or take out ultimate support @ approx. 100.

Somewhere between now and the next few weeks there should be a revelation in this regard.

Until that time, no long-term funds are being placed.

Tuesday, February 28, 2006

Market Update - 28 Feb 06

USDX
Down to 89.90/70 to 88.7. Below that down to 88.05 to 87.22
Above 90.40/65 continuation above 91 and above 92.63

JPY
Now it is right on target (I expected 115.5)
Down to 113/112.90
Above 117.80 could be first good indication of a continuation above 121.38 top, if it is to continue down then this ongoing correction would most probably stay below 116.80/90 my preferred view is still down but changed in the part that this whole action from the 121.38 top is not clearly a reversal pattern so we could expect to see a continuation up above the 121.38 top from some of the lower levels.

EUR
above 1.1950 to 1.2 to 1.2025 to continue down
below 1.1890 to 1.1825 to continue down to 1.15/14

CAD
down

GBP
Above 0.7436 up to 1.7655 to 1.7700/7750
to continue down to 1.69/68 to 1.66

AUD
Above 0.7436 up to 0.7480/85 to continue down.
Below 0.7385 could indicate down to 0.67 - Below 0.7350 is good confirmation
So could be a low risk short from either current levels or little above @ 0.7480, preferably second. Also breaking below 0.7410 will be a first sign of weakness.

Bear: Long to short ratios could be used as a good contrary indicator, since if you see the Open Trades summary on Oanda, there are never more than 15% of all open trades in profit.
In fact since we spoke yesterday, Long to Short on CAD move to even More Net long, and the profitable positions fell from just below 10% to now around 5%

Axiom #1: The secret is to go sideways between the home runs

...... and not lose much during periods of market indecision.

That is what I did -- took a few days off, had a ball and did anything but the market.

I have alot of catching up to do as I see many new posts.

Just to let you all know that I've not forgotten about your contibutions on my UsdJpy long-term play postulates; this week I shall be going thru' the charts again and will post answers to ID's piercing EW questions.

Doing an EW analysis is a time consuming effort and anybody who helps me out in this endeavor can rest assured -- I'm in his debt -- and can call it in anytime.

Risk: Playing it safe is dangerous!

Rule #1: Don't lose money!
Rule #2: Playing it safe is dangerous.

An update:

Positions unchanged; EurUsd (Long) from Friday made a new low, but UsdJpy (Short, also from friday & earlier too) is paying handsomely for my coffin, which, after reading Bear's call, suggests that this might be a good time to visit MoneyTec, socialize with the cuddly, exasperating winners that live there and get some fundamental data on coffins and burial sites.

My call? Still the same -- EurUsd, GbpUsd etc., heading north to close out the rally that started November 16th. After the rally the $ will decimate every mother's son on the planet as he heads for 96-100 (USD Index).

What can I say? Hope I'm not wrong; but if so, I can turn on a dime and go with my buddy.

Rule #1: "Don't lose money!" ... continues to thrive untrammeled!

Rule #3: "Make money!" ..... continues to teach me the lesson of "market patience" as I've made zip since Feb 10. Although nicely profitable for the entire move from Jan 23rd, the turns are where the fun is and this particular one has shown me depths of deceit that ain't even been discovered yet, hehehehe.

Why I answered this newspaper ad, I'll never know -- "Men wanted for hazardous journey. Small wages. Bitter cold. Long months of complete darkness. Constant danger. Safe return doubtful. Honor and recognition in case of success."

:) :) :)

Wave and Cycle observations

Idejan,

Just woke up and checked the charts…………………….

Your thoughts on wave theory and I have to throw in natural fibonacci ratios and cycles are evident throughout everything in life. The one thing that is certain is that things will change, give and take, up and down, good and bad………..

These cycles are even evident in our own trading and our decision making.

It’s obvious to me that my views of the markets are in a corrective mode atm…….There are times to trade large and times to small or not at all…… and nows the time to trade lightly and preserve capital, for the next few days, imho.

One of the best lessons ever taught a novice Bear was this (trading) is not a sprint race it’s a marathon. Some times it’s best to draft, and I think in regards to trading, the winners are the ones who know when to take a rest.

Long CAD? Everyone else is doing it.


"When Alexander saw the breadth of his domain, he wept for therewere no more worlds to conquer."

Just the sight of this chart makes me want to go long, I guess it makes everyone else want to also. Earlier had commented to Idejan that on the long/short indicator on the blog showed 100% short on the swissy.

He informed me that some of the other brokers were showing near 100% long on the Cad. And indeed checked the open long/short ratios at OANDA, sure enough it’s way up there, so my dreams of slaying the market were dashed.

Still took out a small position long……

Just a bear brained thought,....... when everyone is going in the same direction, it’s time for a reverse….. for there’s no one left to take the other side.

Elliott Wave Principle

The Mighty Wave Code :)
This is for all true believers to strengthen their faith, and for all those non believers to convert em into Wave Principle followers and believers :D

This goes even beyond my faith and fascinations.
Simply put, Amazing.

Remember. We are talking here about a small private party, with very few participants, and yet you can clearly see a text book WAVE PRINCIPLE in ACTION.

What can I say. I might be missing something or am I overdosed with EW and I'm seeing things? :)

Not shown here, but interesting to mention is the fact that in the fifth wave on the chart, while number of Readers made to that new High (5), number of page views diverged and made lower high. Typical for 5th waves (more participants, less participation - volume; and divergence in oscillators).

As seen on the chart first drop made to exactly 61.8 fib, then retraced typically for ZZ corrections 50% (55% exactly) of the first drop from the High, and the next drop was exactly 100% extension of first drop A from the B or as on the chart C=A.

This goes as wallpaper on my desktop to remind me of how true Wave Principle is.

Joseph, you could send link to your friends at EWI :)

ID

A view to a funeral or a funeral for a view


He was a cowboy, mister, and he loved the land. He loved it so much he made a woman out of dirt and married her. But when he kissed her, she disintegrated. Later, at the funeral, when the preacher said, 'Dust to dust,' some people laughed, and the cowboy shot them. At his hanging, he told the others, 'I'll be waiting for you in heaven---with a gun.'"


As I was looking at my view of the Euro I was reminded of a funeral, so I searched for a good quote that would symbolize my disdain. Searching thru the many quotes under the heading of funerals I came across this one. Seeing as we have had many illustrations of the old west I thought this would work, made me laugh anyway....

The Bear is lost in the forex, atm....

Price has broken the fork and the parallel, and now looks like its poised to drop farther south, the charts should tell the story.

A series of relabeled charts

Now am beginning to think that we may be in the 5th wave down, and if that's true will be hard pressed to find a good entry south, (we needed to jump on this wave back up in the 2300 area) so scalping hats may be on for this final descent.


One of the problems I have had is labeling some of the minor 5th waves

Here intermediate 1 & 2 seem obvious, but trying to count 5 on the 3rd I come to this conclusion.


To end the count for the 3rd wave back in June, its hard for me to count 5 waves, so I allow for the 4th (retrace) and then end the 3rd wave in December ( red boxed area ).

If any of you were following back on the Moneytec thread I was looking at this as the end of intermediate 5. But here again, was hard pressed to put the final 5 of 5 tag on anything.

And again finishing the 5th of 5 of the 3rd I'm forced to label here. Which leaves us the 4th wave as shown.


I was really expecting the low of the 2/16 (1.1848) candle to hold and to start the "C" wave north of what I thought was a larger correction which would have been defined by the yellow fork. However with the low being taken out this leaves the door open for more south in my books.

One problem I have with this view is the simularity between intermediate waves 2 and 4.

I do show a time for reversal coming up mid to late week but I think we will be slowly dropping for the next few days, however Im now beginning to think that any euro strength will be limited and confined in the black fork, which will be the opportunity to short.


Here's my hourly Im looking at looking to finish this 5th with the completion of the 4th wave triangle.


Still trying to put the pieces back together, will post later with a cleaner view. May need to look at this as a larger corrective move.

Have some more thoughts on different pairs, back in a bit

Sunday, February 26, 2006

Joseph: Good point on NIKKEI, tnx

Joseph,
Excellent point on the triangle.
I had problem labeling prior move up as wave I up, but your point with triangle put more shade on that view.
However, I would not label this whole move up as being wave 2 of a larger (c) down, but rather I'd consider it a possible fist leg (a) of a lager ((b)) since to me prior (a)(b)(c) pattern looks like a finished larger wave ((a)) (first chart in NIKKEI225 post).
And as I wrote in my NIKKEI post, even that this is not an IM, the last move up is IM wave and it has one more up to finish what would then be wave c of a larger (a).
Break above the 16,777.40 top would confirm this last IM wave 5 to finish c. Then we should see if the next drop will stay below that new top for same degree correction wave (b).
The fact that it drop to 78.6 fib is also a good indication that the whole drop could be at least considered finished fist leg if not finished correction.

Taking this as wave 2 of a larger (c) down, with wave 3 being only 100% of wave 1, would get NIKKEI down close to ZERO value.

Not impossible but less likely.
Let's see how it unfolds.
ID

PS. I would not be surprised if move from 2003 unfolds being an IM wave up after all :)