Thursday, February 23, 2006

Wednesday Update


Joseph you make the Bear cringe when you ask him for advice, it’s tough enough for him to trade his own honey let alone someone else.

To comment on the long term trade you have set forth, I need more time to study, but I would say that now’s not the time to enter a long term long. Jmho…..

Here’s some thoughts on overhead resistance………

Very busy here today and will be out tomorrow, apologies for the absence, will get caught up Friday and this weekend.


As a side note, Euro again tested that sliding parallel from my earlier post again and responded with some north action, however price has gone stagnant we need to see some more upwards movement during the Asian session or price will be challenging the line again. My trade picture is teetering atm. Longs are still in play but any thing below 1865 and I’ll have to rethink my position.

Bear

Wednesday, February 22, 2006

Joseph, your USDJPY got me into thinking

Joseph,
if you remember I had a longer term USDJPY on MTec in Nov last year (http://www.moneytec.com/forums/showpost.php?p=157425&postcount=73), but your chart got me into thinking.
However, I have few points which I would like to bring to your attention.
I'll prepare it tomorrow.
Market is in a point where there is no clear indication on possible future short term development, there are still no answers to my previous USDX chart scenarios. But Medium term, we don't have any reversal patterns confirmed, so either way we can expect another move above the 92.6 High.
Until I publish my points on your Longer term JPY, take into consideration this:
Corrections, can start with both Impulsive action (A and C of a corrections can be IM waves) and Corrective action.
But Reversals can only start with Impulsive action, and wave One could be either IM or LD (Leading Diagonal) in both cases the internal structure is 5-3-5-3-5 with the difference - possible overlapping if LD. LDs are rare.
ID

USDJPY weekly with Pitchfork median rendezvous @ 135


If I'm right about that the wave c part of the ongoing correction is yet to come, then a likely point for my entry will be 109

USDJPY monthly chart


On the monthly,

solid support @ 114 & 108

stiff resistance @ 121 & the red trendline. There is also the 200-month MA.

If she breaks thru' then we have something for I believe we've gotta retest 135, then onto 145-150, the domain of the Fib 23.6%.

Fib 38.2% = 192.

If we are truly in V then this figure is but miniscule compared to where we will end up.

Project USDJPY enter and walk away for a year or more!


ID and others, one and all, your input/corrections, cautions etc. sought before I take this big step.

Much obliged,

Joseph

-------------------------------------------------------
USDJPY (long) -- my plan is to plunk down about 3-400K USD in a few tranches, ultimately going to no more than 3 or 4:1 -- after the current correction has clearly completed.

But I will cancel this plan if EW analysis indicates I am in any way wrong in my present wavecount -- in this case I will have to continue with the 4-hr/daily chart trading, which though OK, is just too computer intensive & introverting to be engaged in happily over the long haul.

Capital gain and the high probability of escalating Interest Rate differential are my motives -- just the Interest income alone based on 1:1 will be about $15,000 to possibly upwards of 20K per year.

My entire living expenses (for 2) rarely exceed 20k per year as I live in SE Asia; back stateside this would easily top $60k+/yr., so its easy to see why this setup excites me.

OK then, here goes ....

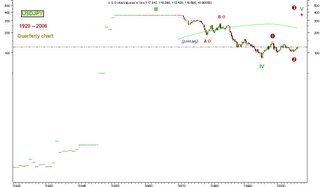
starting with a USDJPY chart from 1920--2006 shown quarterly with my EW.

In the series, a monthy, weekly etc. will follow this post for pinpointing the entry/entries.

Tuesday, February 21, 2006

The Wave Code

EW was developed by analyzing stock markets movements, but it is about the shifts from optimism to pessimism and the other way back. That's why it could be used in other areas of life too. Robert Prechter developed his Socionomics based on the Wave Principle...

It is difficult for me to explain all the market activities behind currency pairs moves, since there are lots of different involved. From hedging to international payments, banking etc and IMHO speculative trading is the smallest factor in those moves. It is probably why you will find comments about how different markets moves caused moves in Forex markets, but not in the opposite way(or very rarely).
Intermerkets correlations, currency correlations and other correlations influencing the markets is important part of the required knowledge trading any market.
I am just an amateur beginner on that field.
That's why I sincerely believe that a good complementary team of traders would be able to produce far more accurate analysis and trading strategies.
Who knows. At some point, our efforts here, could result in a small coherent an complementary team that would be able to work together.
But as I remeber, in the past Banks were providing services, now they sell products.
Currency trading instruments are actualy a products that Banks invented for the sole purpose of making money. For themselfs. That's why you can trade using extremly high leverage, and when infact there is no acctual borrowing, since you trade your colateral against others colaterals and the banks are just clearing the transactions, they charge interest on the leveraged amounts held in positions, the money that doesn't exists nowhere. A nice way to earn ton's of money, isn't it.
In the past it was, me having money in the bank and I hold a note saying I have $1, then somebody borrows money from the bank and he has $1 and all of a suden my $1 became $2. Nowadays credit extends 100 of times in a misterious ways.
That's why I posted the Rhino analogy. Don't try fighting the Rhino. Find way feeding of his back.

I agree with you that you can look at Currency pairs as two individuals, since they are consisted of two different single currencies. So when one Currency pair is falling or rising, it should be because of few different reasons. Let's say we are talking of EURUSD and the pair is moving UP. That could be because:

1.EUR is rising; USD is falling.
2.EUR is rising, USD is holding steady
3.EUR is rising, USD is rising but slower than EUR
4.EUR is holding steady, USD is falling
5.EUR is falling, USD is falling but faster than EUR
(where rising/falling/holding - implies to rising/falling/holding of a single currency related to a basket of other currencies)
I even developed an MT4 indicator (with Stojce programing it) which tries to mesure the Relative Strength of a Single Currencies (based on the RSI of a Basket of Currencies) and presents a RSI of few Major Single Currencies in one indicator window (you've probably seen it in some of my posts).

--------------

The Wave Code
I said I'll recycle some of my thoughts on what I consider to be important issues.
So here are some of my thoughts related to all those approaches looking at price in any mechanical, mathematical or any other way that presumes that future PRICE is predetermined by past Price action, Time, Fundamentals, Mathematical Correlations, linear or non linear.
In my opinion, It is NOT.
You can find answers and some clues, but you could not know the ultimate answer. Just as I can't tell my Bank Account Balance 10 tears from now, based on my historical earnings. It will greatly be determined by my readiness, my mental, emotional and physical fitness to cope with LIFE, recognizing my true "expectations", using my real abilities and finding the best possible way fulfilling them all at right time.
You will, and you probably already have heard many times, about different aspects of Price being this and that, repeating it's own actions, about markets having memory, "Price being a mathematical numeric within the structure of Time that it must conform to, because they operate within the same constants and variables"; and at the same time from those same people you've probably heard about the "disturbances", "fog", "disparities", etc. and that Price will revert back in track with it's fundamentals (what ever they are).
But if the first part of all those statements about price are true, then the last one could not be true. And there could not be any such things like "fog", but could it simply mean than it's our expectations that are in a disagreement with price and that we should revert our expectations back to the Price, and not waiting the Price to revert to it's fundamentals?
And we've came to Expectations.
This was inspired and written by something addressed to me on MoneyTec, and shortly it was that "expectations don't set long term price levels" or something like that.
In fact, PRICE is EXPECTATIONs. It is the Aggregate of all Expectations and The Agreement of the MASS.

(to be continued)
ID

Just one little wonder.
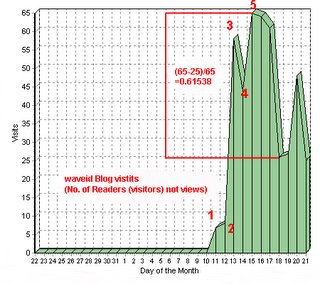
It's a visits (represented by a number of single visitors not a number of visits which is different graph) on this Blog from it's begining till today (not updated in the last few hours and the last point is now higher then the previous low @ 25).
Mail from Chris

Regression to the mean is a very common character of Forex markets and indeed any markets, some look at these situations and simply call then over bought/sold giving contrary trades but of course for every buyer there is a seller.

There are many examples like the one shown attached but how easily does the trading software you use help you to identify these opportunities?
Cheers,
Chris

Elliott Questions

Idejan,

You bring up an interesting topic, that I had few days ago with a friend concerning grand super cycles and currencies.

I was thinking that original EW was analyzed using stocks /commodities, a single vehicle. Where as currencies are a comparison of two individuals. I thought that each currency in the pair would have EW cycles in itself, cycles of growth and recession but not necessarily in opposition to the other pair. So the exchange rate as we view it would exhibit EW structure, but I reasoned it to be more like and ongoing very large corrective pattern, where the top would not be infinite nor the bottom zero.

Just curious to your thoughts.

Been very busy here at the cave, will try to get back and answer some questions.

Great day everyone.

Bear

Longer Term NZDUSD outlook


Suddenly it occurred to me that I can write text here, and not necessarily on the Chart :)
Probably if there was more space on it , it would not occurred to me. I got carried away.

Any way I wrote most of it on the chart and I'll only add few things. Please read the text on the Chart first.
Since the Uptrend from 2001 has IM structure, if we agree with that then only A waves of corrections can have IM structure, indicating that there two more legs before the correction is finished.

Taking that the ongoing development is of pure corrective nature we an say that after this smaller degree correction down is finished, we could expect one more up.
If we don't consider the move from 2001-2005 an IM, then it could be a finished correction....

Looking at currency pairs correlations, we can see that NZD lost it's correlation with both AUDUSD and EU pairs, meaning that when other pairs move strong on dollar NZD doesn't.
On the picture left, we can see that the developing from the 2005 top has clear corrective nature, and is most probably the first Minor wave A of the larger Intermediate (B), currently in a Minute ((c))
Please bear in mind that I don't follow NZD, so I could be easily missing something and be very wrong.

ID

NZDUSD & how the Pitchfork could have saved me!


NZDUSD (4-hr timeframe) cancelled my subscription to the resurrection and sent my credentials to the House of Detention!

My Moneytec post on Feb 10th "NZDUSD .... has fired a missile at the 4-hr descending trendline -- a 4-hr close above 0.6783 will send it into orbit -- of course, what I'm shooting for is a hold for wave C (up) and if it does materialize I will leverage up rapidly and hold for days or weeks -- I'm in since yesterday; STOP is in at breakeven"

I called this wave C blast @ MoneyTec in ID's thread, Market Direction in this pair -- given that my Elliottwave skills reside in the subterranean zone of 2-3 on a scale of 1-10, that was a more-brawn-than-brains call.

The STOP saved me & the "carry" delighted me but the overall mistake haunted me -- I generally don't beat myself up after a failure, but I do develop an insatiable hunger for the "why" and a quick resolution within the framework of my existing toolkit.

I love picking Bottoms and Tops, sometimes even going in without gloves, as in this particular case.

Will I ever change this morbid form of entertainment?

No! But I soy-tenly need to sharpen my other tools some more.

Enter the Pitchfork -- perhaps Bear can point out clearer depictions than the one I'm showing in the attached chart -- but even this one, as-is, would have restrained me sufficiently due to the descent toward the medianline.

Its becoming clear to me quite rapidly that the appropriate adjective to describe the Pitchfork is, ........ formidable!

Perhaps if the male leaders of countries got more mileage out of their medianlines we'd have less war and more humma-humma. :)