KNOW WHAT OTHERS DON'T
Welcome to my Market Directions ramblings.
I mainly focus on Major Forex pairs.
The idea is to grasp Intermediate to Longer term market moves.
I use different aspects of Technical Analysis and I take into consideration economic news data, but just in conjunction with my technical analysis.
Comments and criticism are welcome as long as they are constructive and will help both readers and me to improve our understanding of markets moves.
Saturday, February 25, 2006
My results for entire 4-hr chart move (Jan 23 -- Feb 24)
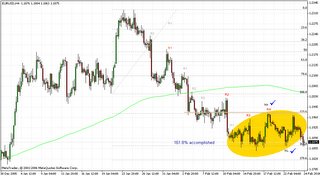
Focus: 4-hr chart -- Dollar rally from Jan 23rd to current point, Feb 24th = 1 month.
Splitting the move into 3 parts: (a), (b) and (c).
(a) The Jan 23rd turn ...... 2 attempts at getting it right, losses reached $1,200 before I my view was respected.
(b) The actual ascent/rally was correctly envisioned...... & was therefore satisfying; result here is quite respectable. Nothing to learn from wins, so let's move on.
(c) The current turn (assumption = northbound rally for EurUsd et al presumed unless proven wrong): -- See the yellow ellipse in the eurUsd chart for where my troubles began on Feb 10th. So far 3-4 attempts at nailing this turn have produced very mixed results; pairs played are EurUsd, GbpUsd, UsdChf, NzdUsd, UsdCad & my chief savior UsdJpy!!! The broker has earned quite a bit from me on this turn as I got booted out often. After counting commissions and swap charges etc., I'm -$746 for this turn, i.e. I've not been paid for about 10 days of work, rather paid the boss instead!
My critique: Parts (a) and (b) are normal operating results, so there is nothing further to add.
Part (c) however has aged me more than Moneytec. And to add fuel to the fire, I nailed EurUsd yesterday with yet another purchase LONG in the upper 1800s. I've also added to my UsdJpy Short. If I'm wrong in calling a turn, my loss for this turn will escalate to about $3,000.
But that is my call and I'm sticking with it. I'm expecting wave C up of the Euro rally that started on November 16th.
My ex-wife once said to me, "you are the darndest stubborn ass*ole I've ever met!"
Yeah, but she was all lovey-dovey when she got half, hehehe.
Just a month in the life of a fella who loves the game!
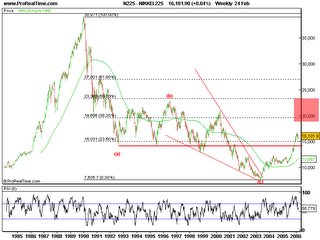
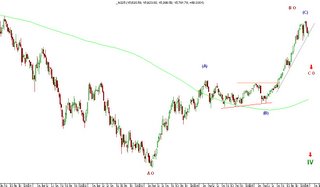
NIKKEI 225 wave count
here is what I believe is a probable NIKKEI wave count.
On this chart is the Longer term NIKKEI action, and it seems to me that it touched the bottom in March 2003 and we are seeing a reversal from there on.
On the next chart is detail of the action from 2003 - today, but let just for a sec stick with this one.
If we were about to see the drop from Dec 1989 to March 2003 as an Impulse, then the Red horizontal line from the end of what could've been wave one, would be our invalidation point, and since NIKKEI broke above that point somewhere in Nov 2005, it invalidated the possible IM down, so we consider a finished ABC pattern. The move from March 2003 looks like an Impulsive move so we could have a potential reversal, or start of a larger Bull trend, but there's lot more for that to be confirmed. Even if we consider this move being a IM part of a ABC ZigZag, or being a ZZ it self, we still have min 22,000 to 23,000 for the first leg up (with this whole move from 2003 being only first wave A of the larger first leg that will finish up in the red box)). It could possibly finish the correction but in my opinion that is less likely.
On this second picture is how I would label the move from March 2003 up.
We could have finished III on the place of sub ((3)) on the Chart, meaning we are in a IV before a final V. But shown on the chart is how i prefer to look at it.
Recent top however, fits almost perfectly for a finished ZZ.
The blue line is the invalidation point for this IM wave scenario.
Take care
ID
Friday, February 24, 2006
Market Update 2
Should stay below 1.2045/55 to continue down to 115<>114 price levels.
GBP
prev: "GBP could stay above recent low in GBP and correct to around 1.74<>1.76 (7433 and 7545) before it continues down to mentioned prices."
Reached the previous post target, now above recent high at 1.7555 up to 1.7662.
On immediate continuation below 1.7440/20 and 1.7281 to retest 1.7047 but probably to continue to 1.69/68
Both GBP and EUR are set for a possible continuation down, but could correct further up.
CAD
Probably down but from 1.1543<>63
Above that 1.1635 to 1.1720
Gold down to 538.4 and blow that to 514.46/513.05
Crude probably one more leg up to finish correction, should be limited to 63.20<>64.40 then down to 50 targets (details posted in other posts)
ID
Note: mind possible news spikes which should not be taken into consideration.
Market Update
USDX
Good levels but wrong timing in previous update..
Made a low at 90.09
Probably it will go down to 89.7 if not lower. Should stay below 90.60/70
Above that, could be a good sign of a continuation above the 92.6 high
On the downside, as in previous update, failure to break below 89.70/60 could be a good indication of a possible continuation above 92.6 top.
Below that, probably to 86.3
Intermediate term still UP.
JPY
previous post(s) still on.
Should stay below 117.40/60 which is the second target up for the ongoing correction, with 116.9 being first one.
I'm confident for at least 115.70/40 being first target down, and second down around 111.80/40 to 110.60 to 109.73>109.38/23
Intermediate term, if this drop goes below 110.70/60 could be a good sign of intermediate top in place @ 121.37, and the correction from that level would be limited and would not exceed this top. Longer term Down.
ID
Thursday, February 23, 2006
For ID: (EW excitement on Nikkei) Top is in?
For entertainment purposes -- this is also one Index that has baffled Bobby Prechter and gang. Perhaps I should call the TOP and charge a million?
Want to split the proceeds, hehehehe? :)
See monthly, weekly and daily -- all my own work!
Top in possibly but still intriguing is the fact that if she is retracing the entire drop from the 1989 top, she has not yet made it to Fib 38.2% -- I recall reading in one of Prechter's works that after a 5-wave decline, a normal retracement is either minimally or typically 38.2% -- don't know if this would apply to an ABC drop, though. Your take?
Answer for Chris,
Re-post of "the assault is on" from last week!
In the green already and now on market's dime -- let her rip, baby! The yellow lines are Fib extensions.
Disappointment has been my closest friend for a week now, as expectations go some distance and then succumb to sloth and the "finger"!
Will this time be more of the same? The STOPs are in!
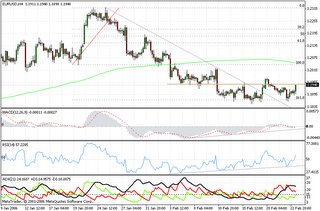
Bear's pitchfork in action again in DX 4-hr and by the way, if this rally does have staying power, remember who is leading the charge -- why, its GBPUSD, of course, in the foreground, but the true accelerator is inverse USDCHF.
EurUsd is not really responding to this windfall; this is not good.
Also notice how nicely my voodoo fib grid is doing its job -- you're supposed to take SHORT profits at 161.8% and then whittle on a piece of wood as the market decides what to do. If she blasts off north from here, then hey, its done an even better job.
All this however, pales in comparison to a daily/weekly/monthly hold.
But I'll take it as practise with chump change!
EURUSD: a special jar of honey for Bear, the resident EurUsd champion!
from Mrs. Gooch's, now called "Whole Foods" (in Calif., perhaps elsewhere too) :) :)
Now dig this!
Note: This is a work in progress as we need more future developments in price and rates to see how solid this concept is.
Study accompanying chart carefully for heretofore paroxysms of lies, deceit & torrents of false data will be vanquished & obliterated within a few seconds.
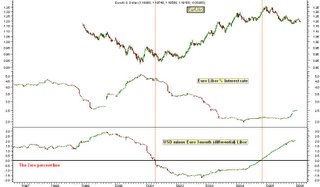
Initial conclusions: The only factor is the 0% Interest Rate differential line (bottom panel) -- makes sense too -- why? well, would you rather the bank pays you Interest on your deposits or would you prefer to pay them for holding your money? Therefore, when the differential of the 2 rates, i.e. USD minus Euro Interest rates crosses the zero perecent line, the investing/yield chasers skiddadle from one zone to the other. Simple, simple, simple, nothing but sheer net! I'm laughing my ass off, hehehehe!
(1) Rising Euroland Interest rates don't mean doodly squat to the direction of EurUsd. In 1999 and 2000, european rates were rising (see chart, middle panel), yet EurUsd was dropping like a stone. Then from 2000-2004 rates were falling precipitously, yet what did EurUsd do? Heck, she flew upwards like a rocket! ..... Therefore, whenever the Media and fatcats utter rubbish about how the dollar is going to fall because ECB is starting a new hike trend, just drop a big, malodorous sausage on their collective heads! Bah! :)
Why? Because its not just the individual rate that's important, rather the differential between them and, even then, its the zero % line that is the final arbiter of the trend in EurUsd. Remember the saying, "money talks, bullsh*t walks?"
(2) The 2 vertical red lines in the chart show where the zero line was crossed. The turn in EurUsd same shortly thereafter and, like inspiration, it came softly and mellifluously. Observe then that it is just a matter of the differential being above or below this line -- it can meander, go up, go down, wander as long as it wants, but as long as it does not cross the zero line, hedge funds and other yield chasers will not budge -- as far as this currency pair is concerned. They may leave if other pairs offer more promise of bettter yield, but as far as this pair is concerned, the zero rate line is the 1000-lb gorilla!
(3) Focusing on the bottom panel of the chart, and to the right, we ain't got nothing to worry about because even if ECB starts hiking and Fed stops, it will be a loooong time before the zero line is crossed! Long live my buddy, USD!
(4) Simplicity is my forte, but is this just too damn simple? Think about women, for example (no disrespect intended or implied) -- every single one that went with me was based on sheer, utter simplicity or directness of my approach; no false pretenses, deceits, lavish stories, preparation, planning, etc., etc. -- if it works in that market, why shouldn't it work here, hehehehe? :) :) :)
This is too deep for me, I'm off for a swim.
Adios amigos.
Joseph
USDJPY: The Interest Rate differential angle
See accompanying chart -- the Japanese Yen 12-month Libor Rate.
LIBOR = London Interbank Offer Rate.
There's been alot of talk recently about Japan starting to embark on a rising rate scenario, but even if this is so, the phenomenal resistance depicted in the LIBOR chart for 12-month Japanese Yen pretty much ensures that the Rate differential between USD and JPY will remain in my favor (for LONG this pair) for quite some time to come, even if USD rates take a bit of a hiatus in hikes.
Unfortunately the (USD--JPY) Libor rate differential is not unequivocally giving me the juice I'm after so there are other fundamental drivers of this pair other than just pure higher returns based on Interest Rate Differentials alone.
But at least this factor is in my favor -- and every noteworthy factor is being taken into consideration here.
For ID & Bear ...... many thanks!
Thanks for the explanation.
As you stress the EW BASICS in your posts, I want you to know that it is doing me a whole lot of good.
I've never had any formal classroom training in EW -- my only method of learning was by being a subscriber @ EW International. The absorption was very haphazard, misaligned and in combination with Steve's and Bobby's numerous terrible calls, left me in a state of despair quite often.
However, nobody is to be blamed; that's just the way it is.
I've had no other teacher simply due to the fact that the other Elliott sites I visited were just obvious scams.
Your long-term EW chart of NZDUSD is a revelation, your caveats about not following this pair notwithstanding. Thanks.
Pour on the coal, my friend -- I accept criticism of my crude methods quite well.
----------------------------------------------
Bear,
I'm looking forward to your rationale why this is a bad time for going really LONG.
Please note that I am waiting for USDJPY to complete the wave C leg of the correction that started in early December before firing my first rocket LONG.
If this wave C down does not materialize, I will have to rethink my count -- Here I know both you and ID can set me straight.
I realize you're busy; take your time -- no action will be taken without considerable deliberation.
Regards
Joseph