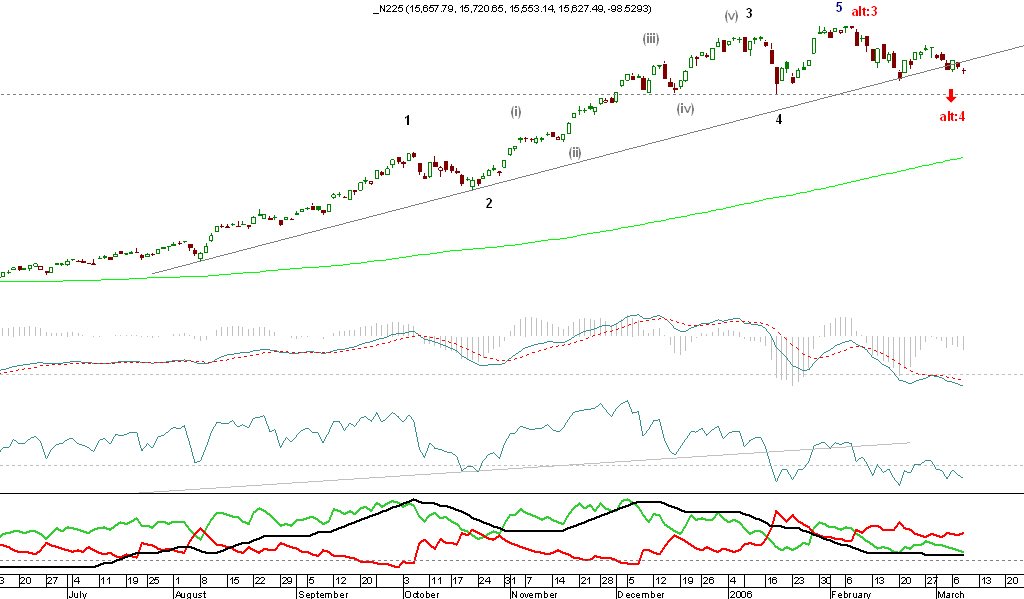
See my attached chart of Nikkei.
This is only for clearing up my misunderstanding/difficulty in the area of 3rd of 3rd and 4th waves.
Which is correct, the count in black/grey or the alt: count in red? Why? ... your reasons, please.
My reason for the alt: red count is that the drop looks like a wave A and is not a 5-er.
One reason I have for the shown count in black/grey is due to my Precter days when I got the impression that 3rd of 3 shows tops on indicators such as Macd, RSi and even on trend strength indicators such as ADX. Then wave 3 gives a slight divergence and then wave 5 gives the ultimate divergence. Additionally, my own observations are that Macd and RSI generate a lower low on wave 4.
I'm fuzzy on this stuff and its quite likely there is an embedded misconception.
Your thoughts/explanations, please?
No comments:
Post a Comment