Saturday, February 25, 2006

Bear brained entries


If I had to pick a level to stage longs on the Yen (this assuming the current high holds) would be from here and I would increase the size of my entries as price dropped

ID: Excuse my manners -- thanks for work on Nikkei!

:) :)

ID: Consider the revised EW count ..... and why!


ID:

Nikkei is not in a bullmarket whatsoever -- the BEAR is alive and well, albeit in hibernation!

After the breakdown from the Primary wave B (B O) triangle in 1997 the entire move thereafter is Primary wave C (C O).

Allow me to explain and I apologize for my brashness & intransigence as a student. :) :)

Nikkei cannot be in a 5-waver for the simple reason that the entire run from March 2003 has to be labeled as an ABC due to the previously missed, yet unmistakeable converging triange at the end of the first stage of the rally from March 2003 -- see my weekly re-counted wave labels.

The triangle is almost perfect and since it cannot occur in a wave 2 position, that first leg of the rally from March 2003 MUST therefore be wave A.

Then, to continue, please observe how beautifully wave B can be drawn.

Then, finally notice how, after price broke-out of the wave B triangle and moved into wave C, the character inherent in wave C caused a sheer vertical climb, the awesome power relinquished also happened to coincide with the previous 2004 top being taken out.

All in all, I've had to revise my entire count by calling the entire runup from March 2003 an Intermediate Wave (2). Wave (3) down comes next and I therefore state that the BEAR market of the Nikkei is going to once again shock all Media as it is set to continue.

My gut instinct had always been that the so-called bullrun the Media was claiming from the 2003 bottom was corrective in nature, but I just could not prove it. Maybe my eyesight has changed or perhaps the Ego was napping and a vital message came thru', hehehehe ....

Oh, also note how nicely the 78.6% level of the entire 1900-1989 run halted Nikkei's drop, but it was whacked pretty good.

Eliminating risk

Joseph & Idejan,

If I can chime in with a couple of thoughts:

Please understand that the Bear is still very much an amateur trader with a long way to go, but the following is the mindset that has been molded by a couple of a very generous gentlemen guru traders to which I am forever thankful.

In a nut shell when we trade, the best case scenario we can hope for is informed speculation.

Now what makes this different from gambling (where the odds are fixed), we can choose the place, time, method and amount of our wager, if this term applies.

We apply our craft to the charts and choose a game plan that we see offers us the best opportunity for profit. The two sides of the equation we need to measure are potential profit and assumed risk.

All that being said, gets me to the issue of my thoughts. Eliminating assumed risk and the free ride.

Please keep in mind that this is the way I think, everyone’s own trading style is unique to them and fits to their own personality, that’s why it so hard to make trade calls, imo. It’s tough to make a call for a multitude of different traders with different risk and reward tolerances.
You asked me the other day why I felt that it was not the time to go long:


To me the prior potential reversal point provides the support (assuming the view is correct), the farther away I enter from that reversal point the more assumed risk I am accepting, ( because I feel that price can always retest this area and the view remain correct).


When I enter a trade I want to enter:

1) Primarily at what I determine to be the reversal point in advance, the first turn and/or

2) The retest of this point.

At this point my risk is the lowest possible and the time it takes for me to be out of risk is the lowest also. ??????????

Eliminating assumed risk.

From this reversal point as price moves away I will quickly cash in a portion of my position and snug my stops to just below the low, preferably to a breakeven + profit position. At this point I have pocketed some pips and the remainder of my position is a free ride to continue to the next turn and we start the process all over again, if my view is incorrect and I get stopped out I still make money. Which is what this game is all about, making money - not necessarily being right.

If I cannot enter at or very near the turn I will not take the trade, I want price to come to me and not the other way around.

From your chart the other day on the long term Yen price had moved north to the resistance/downward sloping trend lines. This would be a point to trade south imo. North positions would be establish after either price had reversed off these lines or price has broken thru and retested the line. To enter now would leave yourself very vulnerable both price and time wise, to the extent that you trade could become profitable with protected stops.

In a nut shell we want to enter at a point that offers us the least amount of risk and time to get ourselves in a profitable position.

Sorry to ramble, hope this makes some sense.

Bear

Accepting WINNERS, accepting LOSERS

I absolutely agree with you Joseph and I'd like to add my comment to this.

If accepting your winners will make you a Winner, accepting your losers will then make you a LOSER.
DON'T accept your losers, unless you like feeling and being a LOSER.

The better way of dealing with your Market calls, is to LEARN to KNOW, when you are RIGHT and knowing when you are WRONG. That way at certain points you will always be Right, and instead of becoming a LOSER you will become WISEer.
I know that we are talking about subtle psychological nuances, but very important ones.
Why? Because there could always be an equal and even better opportunity on the other side of the call. If you look that way on the market, you will always be aware of the opportunities on the both sides. So at points when you argue with Market and it tells you "you should have listen, you are on the wrong side", you can always get on the right side and turn in Profit.
If you have accepted your Loss, you would've most probably needed some time before entering again, and that amount of time you need away from Market after every Loss could grow to the point when you Quit, simply because you either lost your confidence or your money.
Determine price levels that will tell - confirm you being right or wrong should be important part of your strategy from your Money Management decisions point of view too.
Managing your Risk will give you better chances of surviving, but we can't talk about Money Management if we didn't set a Realistic Goals first. Set your Goals first, then decide if you have better chances and opportunities here or you should try a Casino.
ID

My system, rules, timeframe focus and learning modus operandi

Underlying theme: "I don't know nothin!"

Rules: Don't lose money! (I disregard all the zillion rules I read @ MoneyTec and ignore ALL the bestselling authors I've read on this subject -- a boxer who gets pounded in training, arrives for the main event already emaciated internally! Live with the loss, yes, but happily lose while you're learning? .... categorically, NO, NO & NO!

System: Enter/exit when the Head says NO, but the Heart says Yes and the Soul demands it! ...... (all trading books/methodologies, including Elliottwave theory etc. only describe the outward manifestations of the "destroyer" that sits betwixt the Head and the Heart. For, without his presence, all messages from the soul and Heart would arrive at the Head uncorrupted and correctly and would therefore be perfectly executed resulting in there being NO game, for in essence the Soul in everybody is perfect -- & competition is only a means for the weak to distract the strong! All rules about discipline, theories and what-not really deal only with how to put a band-aid on this antediluvian problem plaguing us all" -- there's got to be a better way! Who/what is the "destroyer"? .... aka Ego, the Reactive Mind or whatever you want to call it. His modus operandi? ... for him to live, you must die -- put another way, "to destroy life, to create death!" That's why its never your broker, your analyst etc. that's causing your failure -- the culprit is within and in hiding and is clever, clever, clever!

Timeframe: Monthly/weekly/daily but for 2006 warmups, 4-hr chart + daily. Ignore 1-hr, 30-min and 15-min. timeframes.

Currency Trading experience: 2.5 months; finished 3-month demo trading on December 5th, last year.

How to accelerate/speed up the learning/practise curve with real cash? .. do my homework, make my decision/call and then post it on a bulletin board -- if wrong, I'll never forget the humiliation suffered, worse feeling than the loss of cash, and therefore will research my errors diligently and as a professional.

Year 2006 goal: On December 31st, I'll review my performance; if the return is not commensurate with the effort involved, I'll bow out gracefully and continue to do what I do best -- absolutely zip and enjoying it too!

:) :) :)

My results for entire 4-hr chart move (Jan 23 -- Feb 24)


Focus: 4-hr chart -- Dollar rally from Jan 23rd to current point, Feb 24th = 1 month.

Splitting the move into 3 parts: (a), (b) and (c).

(a) The Jan 23rd turn ...... 2 attempts at getting it right, losses reached $1,200 before I my view was respected.

(b) The actual ascent/rally was correctly envisioned...... & was therefore satisfying; result here is quite respectable. Nothing to learn from wins, so let's move on.

(c) The current turn (assumption = northbound rally for EurUsd et al presumed unless proven wrong): -- See the yellow ellipse in the eurUsd chart for where my troubles began on Feb 10th. So far 3-4 attempts at nailing this turn have produced very mixed results; pairs played are EurUsd, GbpUsd, UsdChf, NzdUsd, UsdCad & my chief savior UsdJpy!!! The broker has earned quite a bit from me on this turn as I got booted out often. After counting commissions and swap charges etc., I'm -$746 for this turn, i.e. I've not been paid for about 10 days of work, rather paid the boss instead!

My critique: Parts (a) and (b) are normal operating results, so there is nothing further to add.

Part (c) however has aged me more than Moneytec. And to add fuel to the fire, I nailed EurUsd yesterday with yet another purchase LONG in the upper 1800s. I've also added to my UsdJpy Short. If I'm wrong in calling a turn, my loss for this turn will escalate to about $3,000.

But that is my call and I'm sticking with it. I'm expecting wave C up of the Euro rally that started on November 16th.

My ex-wife once said to me, "you are the darndest stubborn ass*ole I've ever met!"

Yeah, but she was all lovey-dovey when she got half, hehehe.

Just a month in the life of a fella who loves the game!

NIKKEI 225 wave count

Hi Joseph
here is what I believe is a probable NIKKEI wave count.


On this chart is the Longer term NIKKEI action, and it seems to me that it touched the bottom in March 2003 and we are seeing a reversal from there on.
On the next chart is detail of the action from 2003 - today, but let just for a sec stick with this one.
If we were about to see the drop from Dec 1989 to March 2003 as an Impulse, then the Red horizontal line from the end of what could've been wave one, would be our invalidation point, and since NIKKEI broke above that point somewhere in Nov 2005, it invalidated the possible IM down, so we consider a finished ABC pattern. The move from March 2003 looks like an Impulsive move so we could have a potential reversal, or start of a larger Bull trend, but there's lot more for that to be confirmed. Even if we consider this move being a IM part of a ABC ZigZag, or being a ZZ it self, we still have min 22,000 to 23,000 for the first leg up (with this whole move from 2003 being only first wave A of the larger first leg that will finish up in the red box)). It could possibly finish the correction but in my opinion that is less likely.


On this second picture is how I would label the move from March 2003 up.
We could have finished III on the place of sub ((3)) on the Chart, meaning we are in a IV before a final V. But shown on the chart is how i prefer to look at it.
Recent top however, fits almost perfectly for a finished ZZ.
The blue line is the invalidation point for this IM wave scenario.
Take care
ID

Friday, February 24, 2006

Market Update 2

EUR
Should stay below 1.2045/55 to continue down to 115<>114 price levels.

GBP

prev: "GBP could stay above recent low in GBP and correct to around 1.74<>1.76 (7433 and 7545) before it continues down to mentioned prices."

Reached the previous post target, now above recent high at 1.7555 up to 1.7662.
On immediate continuation below 1.7440/20 and 1.7281 to retest 1.7047 but probably to continue to 1.69/68

Both GBP and EUR are set for a possible continuation down, but could correct further up.

CAD
Probably down but from 1.1543<>63
Above that 1.1635 to 1.1720

Gold down to 538.4 and blow that to 514.46/513.05
Crude probably one more leg up to finish correction, should be limited to 63.20<>64.40 then down to 50 targets (details posted in other posts)
ID

Note: mind possible news spikes which should not be taken into consideration.

Market Update

First USDX and JPY other to follow later.

USDX
Good levels but wrong timing in previous update..
Made a low at 90.09
Probably it will go down to 89.7 if not lower. Should stay below 90.60/70
Above that, could be a good sign of a continuation above the 92.6 high
On the downside, as in previous update, failure to break below 89.70/60 could be a good indication of a possible continuation above 92.6 top.
Below that, probably to 86.3
Intermediate term still UP.

JPY
previous post(s) still on.
Should stay below 117.40/60 which is the second target up for the ongoing correction, with 116.9 being first one.
I'm confident for at least 115.70/40 being first target down, and second down around 111.80/40 to 110.60 to 109.73>109.38/23
Intermediate term, if this drop goes below 110.70/60 could be a good sign of intermediate top in place @ 121.37, and the correction from that level would be limited and would not exceed this top. Longer term Down.
ID

Thursday, February 23, 2006

For ID: (EW excitement on Nikkei) Top is in?


For entertainment purposes -- this is also one Index that has baffled Bobby Prechter and gang. Perhaps I should call the TOP and charge a million?

Want to split the proceeds, hehehehe? :)

See monthly, weekly and daily -- all my own work!

Top in possibly but still intriguing is the fact that if she is retracing the entire drop from the 1989 top, she has not yet made it to Fib 38.2% -- I recall reading in one of Prechter's works that after a 5-wave decline, a normal retracement is either minimally or typically 38.2% -- don't know if this would apply to an ABC drop, though. Your take?

Answer for Chris,


You were wondering about my lower target, it’s the confluence of these lines and levels, just an initial area to look. A better picture of the wave end can be seen in the smaller waves that make up the larger, so as the wave gets under way one can tweak the target.

Hope this helps.

Re-post of "the assault is on" from last week!


In the green already and now on market's dime -- let her rip, baby! The yellow lines are Fib extensions.

Disappointment has been my closest friend for a week now, as expectations go some distance and then succumb to sloth and the "finger"!

Will this time be more of the same? The STOPs are in!

Bear's pitchfork in action again in DX 4-hr and by the way, if this rally does have staying power, remember who is leading the charge -- why, its GBPUSD, of course, in the foreground, but the true accelerator is inverse USDCHF.

EurUsd is not really responding to this windfall; this is not good.

Also notice how nicely my voodoo fib grid is doing its job -- you're supposed to take SHORT profits at 161.8% and then whittle on a piece of wood as the market decides what to do. If she blasts off north from here, then hey, its done an even better job.

All this however, pales in comparison to a daily/weekly/monthly hold.

But I'll take it as practise with chump change!

EURUSD: a special jar of honey for Bear, the resident EurUsd champion!


from Mrs. Gooch's, now called "Whole Foods" (in Calif., perhaps elsewhere too) :) :)


Now dig this!

Note: This is a work in progress as we need more future developments in price and rates to see how solid this concept is.

Study accompanying chart carefully for heretofore paroxysms of lies, deceit & torrents of false data will be vanquished & obliterated within a few seconds.

Initial conclusions: The only factor is the 0% Interest Rate differential line (bottom panel) -- makes sense too -- why? well, would you rather the bank pays you Interest on your deposits or would you prefer to pay them for holding your money? Therefore, when the differential of the 2 rates, i.e. USD minus Euro Interest rates crosses the zero perecent line, the investing/yield chasers skiddadle from one zone to the other. Simple, simple, simple, nothing but sheer net! I'm laughing my ass off, hehehehe!

(1) Rising Euroland Interest rates don't mean doodly squat to the direction of EurUsd. In 1999 and 2000, european rates were rising (see chart, middle panel), yet EurUsd was dropping like a stone. Then from 2000-2004 rates were falling precipitously, yet what did EurUsd do? Heck, she flew upwards like a rocket! ..... Therefore, whenever the Media and fatcats utter rubbish about how the dollar is going to fall because ECB is starting a new hike trend, just drop a big, malodorous sausage on their collective heads! Bah! :)

Why? Because its not just the individual rate that's important, rather the differential between them and, even then, its the zero % line that is the final arbiter of the trend in EurUsd. Remember the saying, "money talks, bullsh*t walks?"

(2) The 2 vertical red lines in the chart show where the zero line was crossed. The turn in EurUsd same shortly thereafter and, like inspiration, it came softly and mellifluously. Observe then that it is just a matter of the differential being above or below this line -- it can meander, go up, go down, wander as long as it wants, but as long as it does not cross the zero line, hedge funds and other yield chasers will not budge -- as far as this currency pair is concerned. They may leave if other pairs offer more promise of bettter yield, but as far as this pair is concerned, the zero rate line is the 1000-lb gorilla!

(3) Focusing on the bottom panel of the chart, and to the right, we ain't got nothing to worry about because even if ECB starts hiking and Fed stops, it will be a loooong time before the zero line is crossed! Long live my buddy, USD!

(4) Simplicity is my forte, but is this just too damn simple? Think about women, for example (no disrespect intended or implied) -- every single one that went with me was based on sheer, utter simplicity or directness of my approach; no false pretenses, deceits, lavish stories, preparation, planning, etc., etc. -- if it works in that market, why shouldn't it work here, hehehehe? :) :) :)

This is too deep for me, I'm off for a swim.

Adios amigos.

Joseph

USDJPY: The Interest Rate differential angle


See accompanying chart -- the Japanese Yen 12-month Libor Rate.

LIBOR = London Interbank Offer Rate.

There's been alot of talk recently about Japan starting to embark on a rising rate scenario, but even if this is so, the phenomenal resistance depicted in the LIBOR chart for 12-month Japanese Yen pretty much ensures that the Rate differential between USD and JPY will remain in my favor (for LONG this pair) for quite some time to come, even if USD rates take a bit of a hiatus in hikes.

Unfortunately the (USD--JPY) Libor rate differential is not unequivocally giving me the juice I'm after so there are other fundamental drivers of this pair other than just pure higher returns based on Interest Rate Differentials alone.

But at least this factor is in my favor -- and every noteworthy factor is being taken into consideration here.

For ID & Bear ...... many thanks!

ID,

Thanks for the explanation.

As you stress the EW BASICS in your posts, I want you to know that it is doing me a whole lot of good.

I've never had any formal classroom training in EW -- my only method of learning was by being a subscriber @ EW International. The absorption was very haphazard, misaligned and in combination with Steve's and Bobby's numerous terrible calls, left me in a state of despair quite often.

However, nobody is to be blamed; that's just the way it is.

I've had no other teacher simply due to the fact that the other Elliott sites I visited were just obvious scams.

Your long-term EW chart of NZDUSD is a revelation, your caveats about not following this pair notwithstanding. Thanks.

Pour on the coal, my friend -- I accept criticism of my crude methods quite well.

----------------------------------------------

Bear,

I'm looking forward to your rationale why this is a bad time for going really LONG.

Please note that I am waiting for USDJPY to complete the wave C leg of the correction that started in early December before firing my first rocket LONG.

If this wave C down does not materialize, I will have to rethink my count -- Here I know both you and ID can set me straight.

I realize you're busy; take your time -- no action will be taken without considerable deliberation.

Regards

Joseph

Wednesday Update


Joseph you make the Bear cringe when you ask him for advice, it’s tough enough for him to trade his own honey let alone someone else.

To comment on the long term trade you have set forth, I need more time to study, but I would say that now’s not the time to enter a long term long. Jmho…..

Here’s some thoughts on overhead resistance………

Very busy here today and will be out tomorrow, apologies for the absence, will get caught up Friday and this weekend.


As a side note, Euro again tested that sliding parallel from my earlier post again and responded with some north action, however price has gone stagnant we need to see some more upwards movement during the Asian session or price will be challenging the line again. My trade picture is teetering atm. Longs are still in play but any thing below 1865 and I’ll have to rethink my position.

Bear

Wednesday, February 22, 2006

Joseph, your USDJPY got me into thinking

Joseph,
if you remember I had a longer term USDJPY on MTec in Nov last year (http://www.moneytec.com/forums/showpost.php?p=157425&postcount=73), but your chart got me into thinking.
However, I have few points which I would like to bring to your attention.
I'll prepare it tomorrow.
Market is in a point where there is no clear indication on possible future short term development, there are still no answers to my previous USDX chart scenarios. But Medium term, we don't have any reversal patterns confirmed, so either way we can expect another move above the 92.6 High.
Until I publish my points on your Longer term JPY, take into consideration this:
Corrections, can start with both Impulsive action (A and C of a corrections can be IM waves) and Corrective action.
But Reversals can only start with Impulsive action, and wave One could be either IM or LD (Leading Diagonal) in both cases the internal structure is 5-3-5-3-5 with the difference - possible overlapping if LD. LDs are rare.
ID

USDJPY weekly with Pitchfork median rendezvous @ 135


If I'm right about that the wave c part of the ongoing correction is yet to come, then a likely point for my entry will be 109

USDJPY monthly chart


On the monthly,

solid support @ 114 & 108

stiff resistance @ 121 & the red trendline. There is also the 200-month MA.

If she breaks thru' then we have something for I believe we've gotta retest 135, then onto 145-150, the domain of the Fib 23.6%.

Fib 38.2% = 192.

If we are truly in V then this figure is but miniscule compared to where we will end up.

Project USDJPY enter and walk away for a year or more!


ID and others, one and all, your input/corrections, cautions etc. sought before I take this big step.

Much obliged,

Joseph

-------------------------------------------------------
USDJPY (long) -- my plan is to plunk down about 3-400K USD in a few tranches, ultimately going to no more than 3 or 4:1 -- after the current correction has clearly completed.

But I will cancel this plan if EW analysis indicates I am in any way wrong in my present wavecount -- in this case I will have to continue with the 4-hr/daily chart trading, which though OK, is just too computer intensive & introverting to be engaged in happily over the long haul.

Capital gain and the high probability of escalating Interest Rate differential are my motives -- just the Interest income alone based on 1:1 will be about $15,000 to possibly upwards of 20K per year.

My entire living expenses (for 2) rarely exceed 20k per year as I live in SE Asia; back stateside this would easily top $60k+/yr., so its easy to see why this setup excites me.

OK then, here goes ....

starting with a USDJPY chart from 1920--2006 shown quarterly with my EW.

In the series, a monthy, weekly etc. will follow this post for pinpointing the entry/entries.

Tuesday, February 21, 2006

The Wave Code

EW was developed by analyzing stock markets movements, but it is about the shifts from optimism to pessimism and the other way back. That's why it could be used in other areas of life too. Robert Prechter developed his Socionomics based on the Wave Principle...

It is difficult for me to explain all the market activities behind currency pairs moves, since there are lots of different involved. From hedging to international payments, banking etc and IMHO speculative trading is the smallest factor in those moves. It is probably why you will find comments about how different markets moves caused moves in Forex markets, but not in the opposite way(or very rarely).
Intermerkets correlations, currency correlations and other correlations influencing the markets is important part of the required knowledge trading any market.
I am just an amateur beginner on that field.
That's why I sincerely believe that a good complementary team of traders would be able to produce far more accurate analysis and trading strategies.
Who knows. At some point, our efforts here, could result in a small coherent an complementary team that would be able to work together.
But as I remeber, in the past Banks were providing services, now they sell products.
Currency trading instruments are actualy a products that Banks invented for the sole purpose of making money. For themselfs. That's why you can trade using extremly high leverage, and when infact there is no acctual borrowing, since you trade your colateral against others colaterals and the banks are just clearing the transactions, they charge interest on the leveraged amounts held in positions, the money that doesn't exists nowhere. A nice way to earn ton's of money, isn't it.
In the past it was, me having money in the bank and I hold a note saying I have $1, then somebody borrows money from the bank and he has $1 and all of a suden my $1 became $2. Nowadays credit extends 100 of times in a misterious ways.
That's why I posted the Rhino analogy. Don't try fighting the Rhino. Find way feeding of his back.

I agree with you that you can look at Currency pairs as two individuals, since they are consisted of two different single currencies. So when one Currency pair is falling or rising, it should be because of few different reasons. Let's say we are talking of EURUSD and the pair is moving UP. That could be because:

1.EUR is rising; USD is falling.
2.EUR is rising, USD is holding steady
3.EUR is rising, USD is rising but slower than EUR
4.EUR is holding steady, USD is falling
5.EUR is falling, USD is falling but faster than EUR
(where rising/falling/holding - implies to rising/falling/holding of a single currency related to a basket of other currencies)
I even developed an MT4 indicator (with Stojce programing it) which tries to mesure the Relative Strength of a Single Currencies (based on the RSI of a Basket of Currencies) and presents a RSI of few Major Single Currencies in one indicator window (you've probably seen it in some of my posts).

--------------

The Wave Code
I said I'll recycle some of my thoughts on what I consider to be important issues.
So here are some of my thoughts related to all those approaches looking at price in any mechanical, mathematical or any other way that presumes that future PRICE is predetermined by past Price action, Time, Fundamentals, Mathematical Correlations, linear or non linear.
In my opinion, It is NOT.
You can find answers and some clues, but you could not know the ultimate answer. Just as I can't tell my Bank Account Balance 10 tears from now, based on my historical earnings. It will greatly be determined by my readiness, my mental, emotional and physical fitness to cope with LIFE, recognizing my true "expectations", using my real abilities and finding the best possible way fulfilling them all at right time.
You will, and you probably already have heard many times, about different aspects of Price being this and that, repeating it's own actions, about markets having memory, "Price being a mathematical numeric within the structure of Time that it must conform to, because they operate within the same constants and variables"; and at the same time from those same people you've probably heard about the "disturbances", "fog", "disparities", etc. and that Price will revert back in track with it's fundamentals (what ever they are).
But if the first part of all those statements about price are true, then the last one could not be true. And there could not be any such things like "fog", but could it simply mean than it's our expectations that are in a disagreement with price and that we should revert our expectations back to the Price, and not waiting the Price to revert to it's fundamentals?
And we've came to Expectations.
This was inspired and written by something addressed to me on MoneyTec, and shortly it was that "expectations don't set long term price levels" or something like that.
In fact, PRICE is EXPECTATIONs. It is the Aggregate of all Expectations and The Agreement of the MASS.

(to be continued)
ID

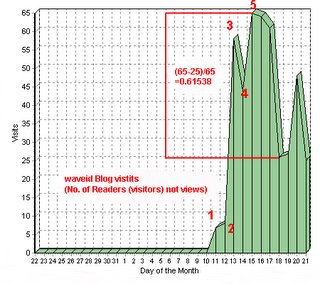
Just one little wonder.
It's a visits (represented by a number of single visitors not a number of visits which is different graph) on this Blog from it's begining till today (not updated in the last few hours and the last point is now higher then the previous low @ 25).

Mail from Chris

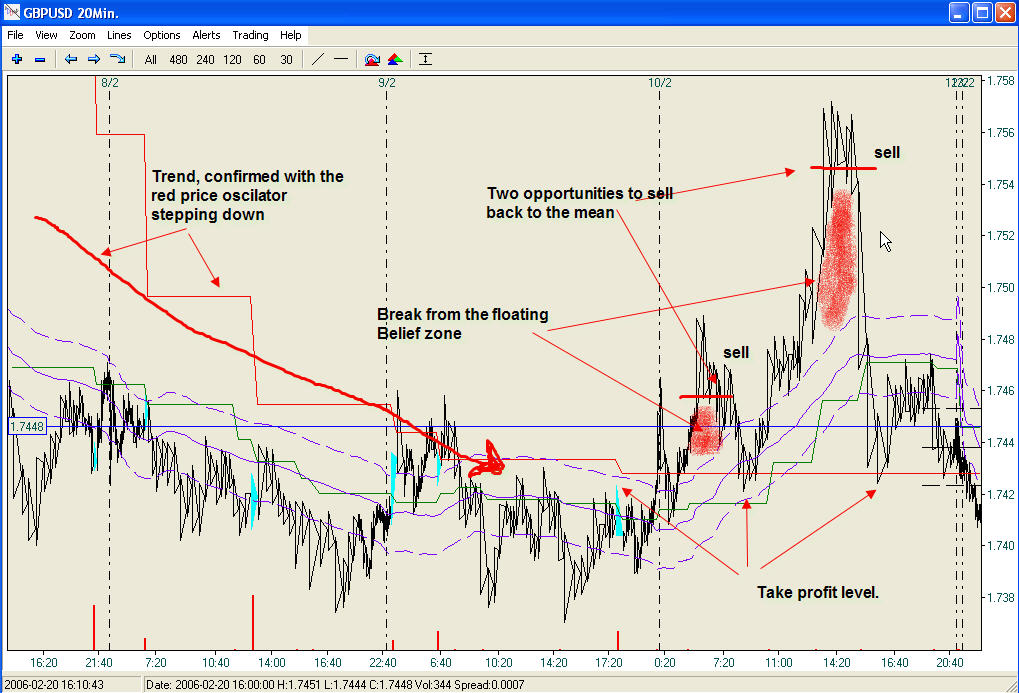
Regression to the mean is a very common character of Forex markets and indeed any markets, some look at these situations and simply call then over bought/sold giving contrary trades but of course for every buyer there is a seller.

There are many examples like the one shown attached but how easily does the trading software you use help you to identify these opportunities?
Cheers,
Chris

Elliott Questions

Idejan,

You bring up an interesting topic, that I had few days ago with a friend concerning grand super cycles and currencies.

I was thinking that original EW was analyzed using stocks /commodities, a single vehicle. Where as currencies are a comparison of two individuals. I thought that each currency in the pair would have EW cycles in itself, cycles of growth and recession but not necessarily in opposition to the other pair. So the exchange rate as we view it would exhibit EW structure, but I reasoned it to be more like and ongoing very large corrective pattern, where the top would not be infinite nor the bottom zero.

Just curious to your thoughts.

Been very busy here at the cave, will try to get back and answer some questions.

Great day everyone.

Bear

Longer Term NZDUSD outlook


Suddenly it occurred to me that I can write text here, and not necessarily on the Chart :)
Probably if there was more space on it , it would not occurred to me. I got carried away.

Any way I wrote most of it on the chart and I'll only add few things. Please read the text on the Chart first.
Since the Uptrend from 2001 has IM structure, if we agree with that then only A waves of corrections can have IM structure, indicating that there two more legs before the correction is finished.

Taking that the ongoing development is of pure corrective nature we an say that after this smaller degree correction down is finished, we could expect one more up.
If we don't consider the move from 2001-2005 an IM, then it could be a finished correction....

Looking at currency pairs correlations, we can see that NZD lost it's correlation with both AUDUSD and EU pairs, meaning that when other pairs move strong on dollar NZD doesn't.
On the picture left, we can see that the developing from the 2005 top has clear corrective nature, and is most probably the first Minor wave A of the larger Intermediate (B), currently in a Minute ((c))
Please bear in mind that I don't follow NZD, so I could be easily missing something and be very wrong.

ID

NZDUSD & how the Pitchfork could have saved me!


NZDUSD (4-hr timeframe) cancelled my subscription to the resurrection and sent my credentials to the House of Detention!

My Moneytec post on Feb 10th "NZDUSD .... has fired a missile at the 4-hr descending trendline -- a 4-hr close above 0.6783 will send it into orbit -- of course, what I'm shooting for is a hold for wave C (up) and if it does materialize I will leverage up rapidly and hold for days or weeks -- I'm in since yesterday; STOP is in at breakeven"

I called this wave C blast @ MoneyTec in ID's thread, Market Direction in this pair -- given that my Elliottwave skills reside in the subterranean zone of 2-3 on a scale of 1-10, that was a more-brawn-than-brains call.

The STOP saved me & the "carry" delighted me but the overall mistake haunted me -- I generally don't beat myself up after a failure, but I do develop an insatiable hunger for the "why" and a quick resolution within the framework of my existing toolkit.

I love picking Bottoms and Tops, sometimes even going in without gloves, as in this particular case.

Will I ever change this morbid form of entertainment?

No! But I soy-tenly need to sharpen my other tools some more.

Enter the Pitchfork -- perhaps Bear can point out clearer depictions than the one I'm showing in the attached chart -- but even this one, as-is, would have restrained me sufficiently due to the descent toward the medianline.

Its becoming clear to me quite rapidly that the appropriate adjective to describe the Pitchfork is, ........ formidable!

Perhaps if the male leaders of countries got more mileage out of their medianlines we'd have less war and more humma-humma. :)

Illustration mentioned in previous update

This is a recycled text from my MoneyTec Elliott Wave thread about fundamentals, and was a part of the answer to a distinguished member of MTec community. It is a good illustration about the correlations in mood and "fundamentals".

...If however we were in a bar, and you'd ask me which one of the two girls sitting at the other side of the bar I'd prefer, the blond or the brunette, (I'd most probably said both, but) let say I'd said I prefer the blond.
On the other hand if I was to give you a rational answer, I'd probably said that I'd consider face, body, length of their legs... and other attributes (or, their "fundamentals").
However both you and me, we know that it is the amount of beer we've drunk that's the most important factor in the decision making process (or the mood).
Oops, I did not mentioned some fundamentals like intelligence... it's definitely the beer.
ID
but then again it's only me being impressed with social phenomenas...
and only if people were rational beings...

Monday, February 20, 2006

Correlations, "Fundamentals" and Elliott Wave

Thank you Joseph,
My favorite show Myth busting got us closer to the point why Elliott Wave principle could be considered a very reliable tool if used properly.
At different times and circumstances people react differently to "fundamentals", depending on their "mood" (illustration to follow). Because of that, you will find that correlations tend to diverge/converge from period to period.

I have mentioned in few occasions that I tend not using Wave Principle mechanically, meaning that I don't observe just a geometry, but I try to comprehend whats behind.
I am aware that for many it is almost stupid thing to even think off and even more to try doing it. Even I would agree, but it is not quite impossible, or at least it is not impossible to get closer to the real picture behind scene.
It requires collecting all the pieces of the puzzle, and trying to fit them all to get the best picture on whats behind the scene.
So beside the EW outlook, Fibonacci lines, S/R and RSI, it requires following news and economic calendar, considering different correlations, comparing different scenarios, and as I said, trying to figure it out how they all fit into the puzzle.
My best analysis came when I was really "into the zone". And I can tell you that at times, I was spending on average 30 minutes on each currency pairs.
  • I start my weekly analysis with checking longer term view I have on a weekly chart, to see if the action so far fits into the preferred longer term view(s)
  • Then I check the Primary and Intermediate outlook on a Daily
  • continue analyzing the unfinished intermediate pattern from the Daily chart on the Hourly chart
  • down to unfinished Minor pattern (and to Minute patterns if I look for intraday)
  • At all this stages I also look/check on important fib lines, S/R and RSI to get more confluence with my EW view

this is the part of my standard Technical Analysis.

But, to get really close to whats behind the scene, you must follow news and economic indicators, and try to comprehend how they fit into the charts and your view.
And in it is not important what you think about the fundamentals, but you must try to figure out, what will Market take into consideration and how it will consider that information.
"Fundamentals" have a very limited influence on the price action, so it is wise to avoid trading the news (announcements of ec. ind.), and you will always get a good indication for your EW view when the dust comes down after the news.
In a moments of inspiration in my first thread on MTec, I have tried to explain what in my opinion are the real fundamentals behind the price action. I could summarize that and post here for those that did not had an opportunity to read it in some of my nest updates. Not a very entertaining reading as Joseph's myth busting episodes :)

USDX
check previous post, this is follow up:
Down to 90.15<>90 intraday
Looks like we have at least a minute top, and we can expect DX to go to 88.74 and most probably below that and below the low of 87.83 down to 86.30/20
Failure to break below 89.70<>89.60 could be a good indication of a possible continuation up above 92.63 top.

in pairs
first my favorite for some time now
JPY
previous post still valid
stayed below 119.37 and now it looks like we are in a downtrend to mentioned targets to min 115.3 but more probably 113<>107 (111.6<>110.7)
Intraday, below 117.85 is good for min 117.20/10

EUR
from previous update:
"Intraday, we could see this drop finishing little lower, just below 1.18<>1.17 in EUR, after it corrects to 1.1940/46. "
passed 1.1940/46 so the new update on EURUSD is:
Intraday down to 1.1915 but not lower than 1.1905 to continue up to 1.2045/55
Above that could mean min. 1.2200/40
I believe that we are in a continuation down to min 1.15/14 and I expect that this ongoing correctional action will finish at 1.2045/55 or below, but not higher than 1.2321 high. After that I expect a drop to 1.15/14 price levels.

from previous update:
"GBP could stay above recent low in GBP and correct to around 1.74<>1.76 (7433 and 7545) before it continues down to mentioned prices."
confirmed for now and still valid.

from previous update:
"CAD - Not very clear, but up to 1.167 and possibly up to 1.2 longer term down to below 1.00"
failed, so it could mean continuation down. If so Intraday should be limited below 1.1525 to continue down to below 1.12

from previous update:
"NZD possible small correction to .671<>.675 then down to .664<>.66"
fell directly to target zone after the post, low at .6621
Most probable next move up to .6790 to .685

Both CrudeOil and Gold still in correctional move down, but at the moment thay are in a smaller sub wave up of that correction and they both have some more on the upside before they continue down.

ID

Excellent primer


Excellent primer, thanks Bear & Joseph

Being a keen student, I have drawn some pitchforks on the EURUSD chart. Looking at targets for the c wave, 161% of wave a, a=c & two pitchforks all give a target around 1.2560-1.2630. (I'll attach a chart if I can find out how.....)

Bear, I notice that you have two target areas on an earlier chart, I think one of them matches the one I have come up with. How did you identify the other target?

Thanks
Charlie

Myth busting #2: CAD is a commodity currency!


It is downright dangerous to rely hugely on intermarket relationships -- why? .. for they can change on a whim and leave you high and dry.

If you insist on a correlation then a more appropriate one for CAD is the 2-yr Canadian bond and then the Toronto stock Index.

See CAD and Oil chart with long history. Crude Oil in lower window has not been updated to 2006, but you know that it topped out at $70.85.

What's gotten the Media into this commodity currency misnomer is the fact that CAD and Crude have gone together since 2001.

But what about before that?

Crude's been in an uptrend for at least 65 years whereas CAD has been in a downtrend for 30 of those years.

How can a downtrend and an uptrend be positively correlated?

Furthermore observe that from Jan '99 -- Nov '00 Crude shot up almost vertically; a giant move it was -- and what did CAD do? She just responded with a feeble move to the upside that didn't even go the extent of Crude's move.

Tha above is my work, but look for confirmation of this in the February 2006 CurrencyTrader Magazine article on CAD.


excerpt:

Canada is an important exporter of commodities such as crude oil, natural
gas, nickel, copper, and lumber, but none of these correlations are anywhere
near as high as for two-year notes or the SP-TSX index. It would be
just as fair given this data to call the CAD a “note currency” or a stockcurrency as it would be to label it a “commodity currency.”

There is however a sidedoor relationship with the CRB index.

The next dopey fundo analyst deserves a swift kick in the 2-moon junction.

For likeminded Pitchfork students .... enjoy! :)

Firstly, let's not forget who's responsible for opening these particular floodgates and unleashing a torrent of rocketfuel to my technical engine -- that poy-son be Bear.

My study is concluded. Now on to application.

Here then, after scouring the Web and Bear's preferred site for relevant data pertaining to Pitchfork power, I've narrowed the fuel down to just one article, which I believe packs a solid punch for other newbies (like myself).

One could always go to to read Tim Morge's book if one so desires, but I believe the article I'm offering here is more than adequate for immediate sorties and getting one's feet wet.

Go to the following link and study the article.

http://www.investopedia.com/printable.asp?a=/articles/forex/05/AndrewsPitchfork.asp

For Bear: Pitchfork timeframe usage success?

In your own personal charting experience, which timeframe have you been most successful with w.r.t. Pitchfork usage?

Thank you

Joseph

If you don't risk anything, you risk even more!

God help us! This cave dweller not only knows how to eat honey; he's versatile with trendlines too. :)

Thanks Bear! I'm spending time today at Medianline for additional nuggets, if any. There is considerable promise in this tool, especially the Schiff variation, which, at first encounter, appears to suit my personality natively.

And, for vistors, do not miss checking out Idejan's Dollar Index daily chart (a few posts back).

Why? Because its a work of art, that's why -- of the same order of magnitude as Maradona's soccer goal past Peter Shulton in Argentina vs England aeons ago.

Furthermore, for even more shockers, go back to the Moneytec thread of the same name as this blog's header and revel in the numerous correct calls made by this gifted elliottician.

Its not going to be too much longer before the fatcats discover him and entice him stateside with million-dollar salary offers -- then its going to cost us USD 100/chart, hehehe -- get 'em now while he is still a pre-star!

Sunday, February 19, 2006

A Pitchfork Primer, finished


Next variation on the pitchfork is the Schiff;
B and C points remain the same but the A point or handle is moved to the midpoint of the A to B line.

You will have to experiment with this to understand it’s beauty, this variation of the pitchfork defines price repeatedly in the forex markets. I often draw the shiff at the same time I draw the normal fork, for price will generally respect these lines.

The other variation not shown would be a discretionary fork, basically your adjusting the “A” point in any position so that the median and parallels define price, more of an equidistant channel.

The nuances of the pitchfork are too many to list one just needs to study to see what fits with the individual , but imho it well worth the effort.

Bear

A Pitchfork Primer, cont’d.


Here’s my feeble attempt at pitchfork explanations.

Imo, there are basically 3 different variations of pitchforks, the differences are in the positioning of the “A” point or handle. The Three are Traditional, Schiff and what I call Discretionary.


The Traditional pitchfork drawn from 3 consecutive swing points basically gives us an angle for future price movement, like drawing a channel in advance. The upper, lower and median lines are like targets for price. Price will normally reverse or stall at these levels, once a reversal takes place price will normally travel to the next line. If price penetrates a line it will normally retest that line before going on.

Other lines that come into play are the; See Chart

Action/target lines, these would be trend lines that are drawn from the A point out thru the B and C points

Warning lines (parallel lines) that are spaced equidistant out from the fork

The normal use of pitchforks is to draw it from the three points and the median would be the logical target. A lot of traders like to see the parallel line that is drawn from the 3rd or final "C" point retested to confirm that price is respecting the fork before entering. Like price making an EW 1 and 2 points back at the parallel before heading on to 3.

One thing I do take notice, I like to see price make the median in the same length of time as measured from the A point to the cross bar or center point of the B to C line. This is shown on the chart as the orange shaded area and then duplicated in the pink. This is just my take, but if price fails it’s attempt to reach the median in this time, it normally means that price is headed back towards the level of C or the Action/reaction line

One other thing is support/resistance lines drawn parallel with the fork thru price often come into play, often times you will see the angle or slope of the fork resonate or duplicate itself throughout the wave.

One more chart coming…..

Pitchfork Phantasmagoria


Thanks Bear, my graduation certificate please ...... :) :)